Ward profile
Employment, Benefits and Pension
Crime and Anti-social Behaviour
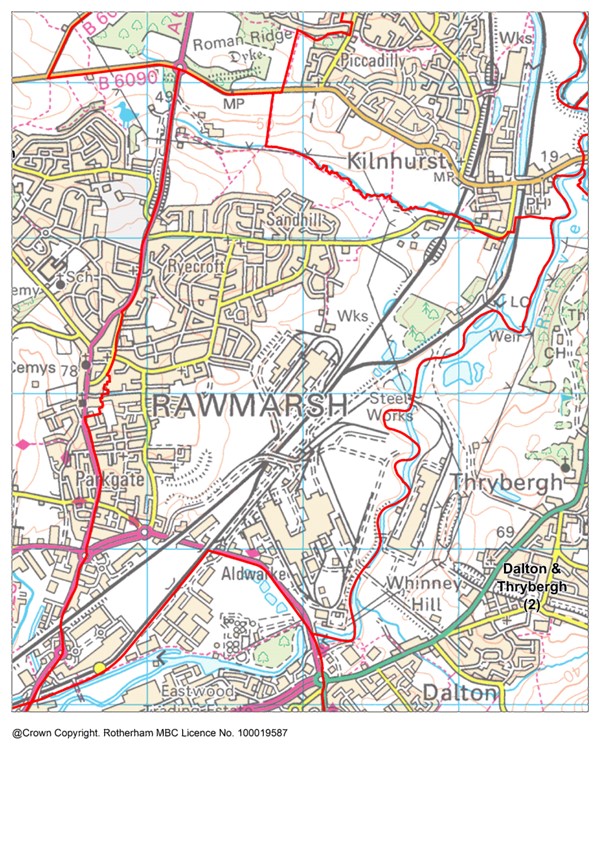
Description
Rawmarsh East Ward lies in northern Rotherham with a population of 9.545 (2021 census).
The ward is represented by two members of the Council.
Overall, Rawmarsh is an urban area with 18,900 residents, split between two Rawmarsh wards.
The ward has a mixture of residential areas with Parkgate having the most terraced housing. The far south of the ward is a commercial and industrial area which includes part of Parkgate Retail World and industrial areas. The east of the ward includes the Aldwarke steel works.
There is open countryside on the northern fringe of the ward.
Find out more about Rawmarsh East on Rotherham Data Hub
Population
The population of Rawmarsh East ward has increased by 8% since 2011 at a faster rate than the increasing borough population. The age structure of the population is slightly younger than the Rotherham average.
|
Age |
Ward Population |
Ward Percentage |
Rotherham Percentage |
|
Age 00-15 |
1992 |
20.87 |
18.89 |
|
Age 16-24 |
947 |
9.92 |
9.60 |
|
Age 25-44 |
2506 |
26.25 |
25.09 |
|
Age 45-64 |
2512 |
26.32 |
26.76 |
|
Age 65+ |
1588 |
16.64 |
19.66 |
|
Total |
9545 |
100.00 |
100.00 |
Ethnicity
Rawmarsh East is among the 80% of wards in Rotherham where the white British population exceeds 90%. However, the 2020 School and Pupil Census shows ethnic minority pupils accounting for over 10% of the school age population.
|
Ethnicity |
Ward % |
Rotherham % |
England % |
|
White British |
92.20 |
88.30 |
74.70 |
|
Asian/Asian British |
1.70 |
5.30 |
9.60 |
|
White Other |
2.60 |
2.80 |
6.30 |
|
Mixed/multiple |
1.70 |
1.40 |
3.00 |
|
Black/Black British |
1.20 |
1.10 |
4.20 |
|
Other |
0.70 |
1.10 |
2.20 |
Housing
Total dwellings (2021 Census) - 4432
Total dwellings (2011 Census) - 3877
Change since 2011 (%) – 14.30
Number of households
Households (2021 Census) - 4299
Households (2011 Census) - 3806
Change since 2011 (%) – 10.30
Population Density (no. of residents per square Kilometre) 2021 Census
Ward – 1536.00
Rotherham - 927.70
Employment, Benefits and Pensions
In Rawmarsh East ward the total claimant count in July 2023 is 340, which is 5.6% of the working age population. This is higher than the Rotherham average where the claimant count is 4.3% of the working age population.
Most employment opportunities in Rawmarsh East ward are based in transport and storage, retail and education. Production industries are well below borough averages. Employment levels in the ward depend on opportunities elsewhere as local jobs are only sufficient for 20% of local workers.
Health
In Rawmarsh East 41.7% are in very good health, and 1.5% are in very bad health. In comparison, in Rotherham 44.2% are in very good health and 1.6% are in very bad health.
According to Census 2021, in Rawmarsh East ward, 23.2% of the population are considered to be disabled under the Equality Act 2010, compared to 21.1% in Rotherham and 17.3% in England. The definition of disability in Census 2021 was: People who assessed their day to day activities as limited by long-term physical or mental health conditions of illnesses are considered disabled. Thus definition of a disabled person meets the harmonised standard for measuring disability and is in line with the Equality Act (2010).
Life expectancy
In the period 2016-2020, Rawmarsh East ward's life expectancy at birth for females is 79.5 years and for males is 74.6 years. This is worse than the England average. In comparison, Rotherham's life expectancy for females is 81.3 years and for males is 77.6 years.
Disease and lifestyle
In the 2016-20 time period, the mortality ratio for deaths from strokes in Rawmarsh East ward is 127.7. This is similar to England. In comparison, the lowest mortality ratio for stroke deaths in a Rotherham ward is 56.7 in Aston & Todwick ward and the highest ratio is 185.8 in Rother Vale ward.
In the 2016-20 time period, the mortality ratio for deaths from respiratory disease in Rawmarsh East ward is 168.5. This is worse than England. In comparison, the lowest mortality ratio for deaths from respiratory disease in a Rotherham ward is 79.9 in Bramley & Ravenfield ward and the highest ratio is 209.1 in Rother Vale ward.
In the 2016-20 time period, the mortality ratio for deaths from coronary heart disease in Rawmarsh East ward is 105.2. This is similar to England. In comparison, the lowest mortality ratio for deaths from coronary heart disease in a Rotherham ward is 76.2 in Aston & Todwick ward and the highest ratio is 152.1 in Rotherham East ward.
In the 2016-20 time period, the mortality ratio for deaths from circulatory disease in Rawmarsh East ward is 117.9. This is similar to England. In comparison, the lowest mortality ratio for deaths from circulatory disease in a Rotherham ward is 73.5 in Aston & Todwick ward and the highest ratio is 141.9 in Rother Vale ward.
In the 2016-20 time period, the mortality ratio for deaths from cancer in Rawmarsh East ward is 129.3. This is worse than England. In comparison, the lowest mortality ratio for deaths from cancer in a Rotherham ward is 94.2 in Aston & Todwick ward and the highest ratio is 152.1 in Rother Vale ward.
Obesity
In Rawmarsh East ward (for the time period 2019/20-2021/22) the percentage of children in Reception (aged 4-5 years) classified as overweight or obese is 27.4%. This is worse than the England average. The percentage of children classified as obese (including severe obesity) is 13.7%. This is worse than the England average. In Rotherham overall (for comparison) the percentage of children aged 4-5 years classified as overweight or obese is 25.1% and the percentage classified as obese (including severe obesity) is 11.4%.
In Rawmarsh East ward (for the time period 2019/20-2021/22) the percentage of children in Year 6 (aged 10-11 years) classified as overweight or obese is 37.7%. This is worse than the England average. The percentage of children classified as obese (including severe obesity) is 24.6%. This is worse than the England average. In Rotherham overall (for comparison) the percentage of children aged 10-11 years classified as overweight or obese is 38.8% and the percentage classified as obese (including severe obesity) is 25.1%.
Education
According to Census 2021, in Rawmarsh East ward 27.8% of residents aged 16 or over have no qualifications, and 15.7% are qualified to level 4 or above. In comparison 23.4% in Rotherham have no qualifications and 23.1% are qualified to level 4 or above.
For Rawmarsh East ward in 2023, there was a total of 136 pupils at the end of key stage 2, of which 87.5% were disadvantaged compared to 54.5% for Rotherham overall. The percentage of pupils in the ward achieving the expected standard in Reading, Writing and Maths was 44.1%, compared to 54.5% in Rotherham and 59% nationally.
For Rawmarsh East ward in 2023, there was a total of 102 pupils at the end of key stage 4, of which 89.2% of pupils were disadvantaged, compared to 53.4%% in Rotherham overall. The average Attainment 8 score for the ward was 36.3, compared to 43.2 in Rotherham and 46.2 nationally.
Crime and Anti-Social Behaviour (ASB)
Levels of recorded crime and anti-social behaviour in Rawmarsh East ward are higher than the Rotherham average.
In Rawmarsh East ward in 2021 there were a total of 1,127 recorded crimes. This equates to 118 recorded crimes per 1,000 population compared to 110 per 1,000 population for Rotherham.
In Rawmarsh East ward in 2021, there were a total of 187 recorded incidents of anti-social behaviour. This equates to 20 recorded incidents per 1,000 population, compared to 19 per 1,000 population for Rotherham.
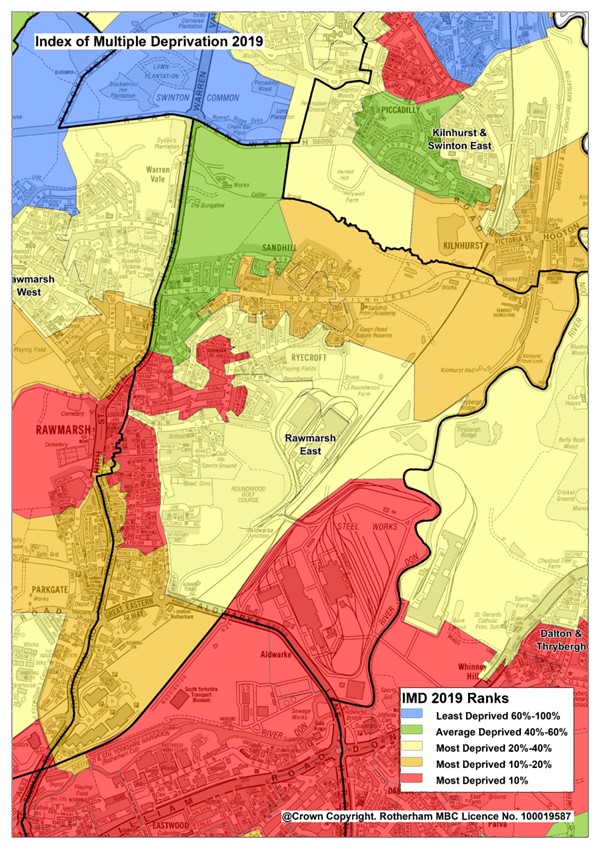
Index of Multiple Deprivation 2015 & 2019
Rawmarsh East ward has a rank of 5 out of 25 wards in Rotherham and is in Decile 2. Of the 25 wards in Rotherham, 5 are in the top 20% most deprived in the country (deciles 1 and 2). The top 3 most deprived wards in Rotherham are Rotherham East, Dalton & Thrybergh and Maltby East.
Deprivation in Rawmarsh East ward is well above the borough average and in most of the ward is also well above the national average. Rawmarsh North East and Rawmarsh South neighbourhoods are within the most deprived 10% in England.
In Rawmarsh East ward, the proportion of all children aged 0-15 living in income deprived families is 28.8% and the proportion of those aged 60 or over who experience income deprivation is 23.2%. The ward with the highest proportion of children aged 0-15 living in income deprived families is Dalton & Thrybergh ward at 39.1%. The ward with the highest proportion of those aged 60 and over who experience income deprivation is Rotherham East ward at 36.9%.
Data Sources
- Data sources contained within this document include:
- Population - ONS Census data via NOMIS Ethnicity - ONS Census data via NOMIS
- Religion - ONS Census data via NOMIS
- Housing - ONS Census data via NOMIS
- Households - ONS Census data via NOMIS
- Unemployment claimants aged 16-64 - ONS Claimant Count via NOMIS
- Types of employment - Business Register and Employment Survey via NOMIS
- General Health - ONS Census data via NOMIS
- Disability - ONS Census data via NOMIS
- Life expectancy at birth - Public Health England Fingertips
- Causes of death - Public Health England Fingertips
- Overweight and obesity in children - Public Health England Fingertips
- Highest level of education - ONS Census data via NOMIS
- Key Stage 2 and Key Stage 4 attainment - RMBC Children & Young People's Services
- Index of Multiple Deprivation - Ministry of Housing, Communities and Local Government Community assets map - OpenStreetMap via TomTom/Microsoft Corporation
- Access to green space - Green Space Index 2023 commissioned by The Ordinance Survey and undertaken by The Fields in Trust
- Crime data - www.police.uk

