Ward profile
Employment, Benefits and Pension
Crime and Anti-social Behaviour
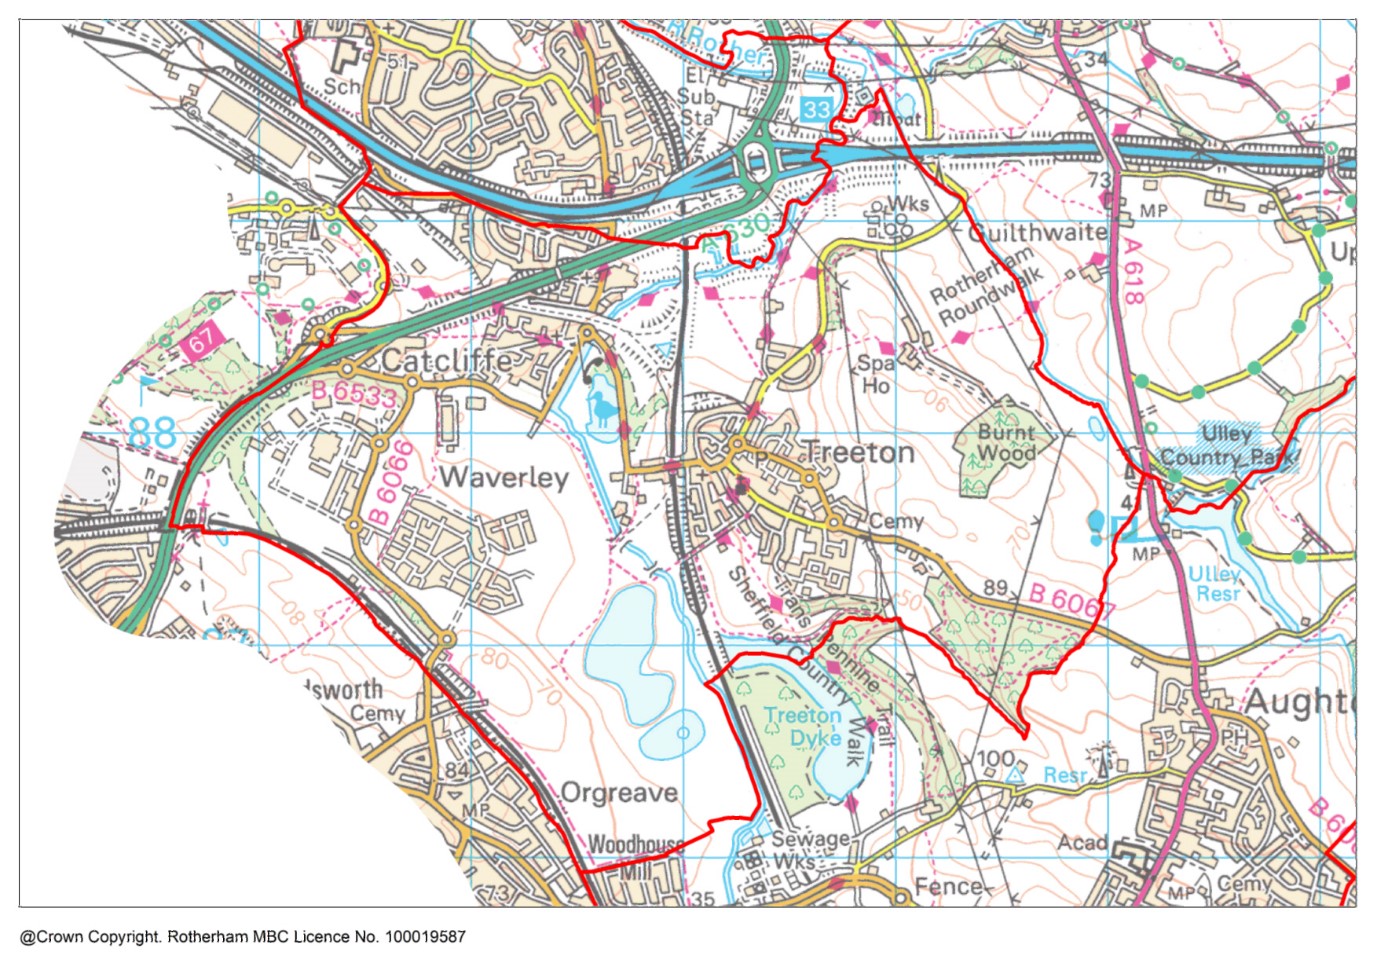
Description
Rother Vale ward is situated in the southwest of Rotherham with a population of 8,609 (2021 census).
The ward is represented by two members of the Council.
Rother Vale is served by three parish councils, Catcliffe (population 2558) in the north of the ward, Treeton (population 3,272) in the east of the ward and Waverley Community Council (with a growing population currently estimated at 3,300) in the west.
Waverley includes a large-scale housing development being built over a 20-year period (2012-32), and new industry at the Advanced Manufacturing Park.
Waverly was the site of the British Steel Corporation Orgreave coking plant, where confrontation between the police and pickets engaged in the 1984 miners’ strike, has been described as one of the most violent clashes in British industrial history.
Find out more about Rother Vale on Rotherham Data Hub
Population by Age
The population of Rother Vale ward has increased significantly since 2011 due to large housing developments. The age structure of the population is younger than the Rotherham average, which reflects the new housing developments attracting young families to the area.
|
Age |
Ward Population |
Ward Percentage |
Rotherham Percentage |
|
Age 00-15 |
1949 |
22.64 |
18.89 |
|
Age 16-24 |
778 |
9.04 |
9.60 |
|
Age 25-44 |
3121 |
36.25 |
25.09 |
|
Age 45-64 |
1893 |
21.99 |
26.76 |
|
Age 65+ |
868 |
10.08 |
19.66 |
|
Total |
8609 |
100.00 |
100.00 |
Ethnicity
Rother Vale is the fifth most ethnically diverse ward in Rotherham with over 13% from ethnic minority backgrounds, including 5.5% of Asian heritage. the 2020 School and Pupil Census shows ethnic minority pupils accounting for over 12%.
|
Ethnicity |
Ward % |
Rotherham % |
England % |
|
White British |
86.20 |
88.30 |
74.70 |
|
Asian/Asian British |
5.50 |
5.30 |
9.60 |
|
White Other |
2.60 |
2.80 |
6.30 |
|
Mixed/multiple |
2.50 |
1.40 |
3.00 |
|
Black/Black British |
2.20 |
1.10 |
4.20 |
|
Other |
0.90 |
1.10 |
2.20 |
Housing
Total dwellings (2021 Census) - 3655
Total dwellings (2011 Census) - 2899
Change since 2011 (%) – 26.10
Number of households
Households (2021 Census) - 3486
Households (2011 Census) - 2899
Change since 2011 (%) – 20.20
Population Density (no. of residents per square Kilometre) 2021 Census
Ward – 977.40
Rotherham - 927.70
Employment, Benefits and Pensions
In Rother Vale ward the total claimant count in July 2023 is 130, which is 3.2% of the working age population. This is lower than the Rotherham average where the claimant count is 4.3% of the working age population.
Rother Vale ward has high proportion of workplaces in manufacturing, retail, professional, scientific, and technical services, which reflects the Advanced Manufacturing Park, and a low proportion in public services. The number of jobs based in the ward is above borough average, being equal to 87% of the local working age population.
Health
In Rother Vale 52.6% are in very good health, 0.9% are in very bad health. In comparison, in Rotherham 44.2% are in very good health and 1.6% are in very bad health.
According to Census 2021, in Rother Vale ward, 16.6% of the population are considered to be disabled under the Equality Act 2010, compared to 21.1% in Rotherham and 17.3% in England. The definition of disability in Census 2021 was: People who assessed their day to day activities as limited by long-term physical or mental health conditions of illnesses are considered disabled. Thus definition of a disabled person meets the harmonised standard for measuring disability and is in line with the Equality Act (2010).
Life expectancy
In the period 2016-2020, Rother Vale ward's life expectancy at birth for females is 77.9 years and for males is 75.9 years. This is worse than the England average. In comparison, Rotherham's life expectancy for females is 81.3 years and for males is 77.6 years.
Disease and lifestyle
In the 2016-20 time period, the mortality ratio for deaths from strokes in Rother Vale ward is 185.8. This is worse than England, and is the ward with the highest mortality ratio for stroke deaths in Rotherham. In comparison, the lowest mortality ratio for stroke deaths in a Rotherham ward is 56.7 in Aston & Todwick.
In the 2016-20 time period, the mortality ratio for deaths from respiratory disease in Rother Vale ward is 209.1. This is worse than England, and is the highest mortality ratio for deaths from respiratory disease of all Rotherham wards. In comparison, the lowest mortality ratio is 79.9 in Bramley & Ravenfield ward.
In the 2016-20 time period, the mortality ratio for deaths from coronary heart disease in Rother Vale ward is 124.8. This is similar to England. In comparison, the lowest mortality ratio for deaths from coronary heart disease in a Rotherham ward is 76.2 in Aston & Todwick ward and the highest ratio is 152.1 in Rotherham East ward.
In the 2016-20 time period, the mortality ratio for deaths from circulatory disease in Rother Vale ward is 141.9. This is worse than England and is the highest ratio of any ward in Rotherham. In comparison, the lowest mortality ratio for deaths from circulatory disease in a Rotherham ward is 73.5 in Aston & Todwick.
In the 2016-20 time period, the mortality ratio for deaths from cancer in Rother Vale ward is 152.1. This is worse than England and is the highest ratio of any ward in Rotherham. In comparison, the lowest mortality ratio for deaths from cancer in a Rotherham ward is 94.2in Aston & Todwick.
Obesity
In Rother Vale ward (for the time period 2019/20-2021/22) the percentage of children in Reception (aged 4-5 years) classified as overweight or obese is 22.2%. This is better than the England average. The percentage of children classified as obese (including severe obesity) is 5.6%. This is better than the England average. In Rotherham overall (for comparison) the percentage of children aged 4-5 years classified as overweight or obese is 25.1% and the percentage classified as obese (including severe obesity) is 11.4%.
In Rother Vale ward (for the time period 2019/20-2021/22) the percentage of children in Year 6 (aged 10-11 years) classified as overweight or obese is 40.4%. This is worse than the England average. The percentage of children classified as obese (including severe obesity) is 23.4%. This is worse than the England average. In Rotherham overall (for comparison) the percentage of children aged 10-11 years classified as overweight or obese is 38.8% and the percentage classified as obese (including severe obesity) is 25.1%.
Education
According to Census 2021, in Rother Vale ward 15.1% of residents aged 16 or over have no qualifications, and 35.4% are qualified to level 4 or above. In comparison 23.4% in Rotherham have no qualifications and 23.1% are qualified to level 4 or above.
For Rother Vale ward in 2023, there was a total of 135 pupils at the end of key stage 2, of which 10.4% were disadvantaged compared to 54.5% for Rotherham overall. The percentage of pupils in the ward achieving the expected standard in Reading, Writing and Maths was 68.9%, compared to 54.5% in Rotherham and 59% nationally.
For Rother Vale ward in 2023, there was a total of 80 pupils at the end of key stage 4, of which 25% of pupils were disadvantaged, compared to 53.4%% in Rotherham overall. The average Attainment 8 score for the ward was 41.6, compared to 43.2 in Rotherham and 46.2 nationally.
Crime and Anti-Social Behaviour (ASB)
Levels of recorded crime and anti-social behaviour in Rother Vale ward are lower than the Rotherham average.
In Rother Vale ward in 2021 there were a total of 778 recorded crimes. This equates to 90 recorded crimes per 1,000 population compared to 110 per 1,000 population for Rotherham.
In Rother Vale ward in 2021, there were a total of 149 recorded incidents of anti-social behaviour. This equates to 17 recorded incidents per 1,000 population, compared to 19 per 1,000 population for Rotherham.
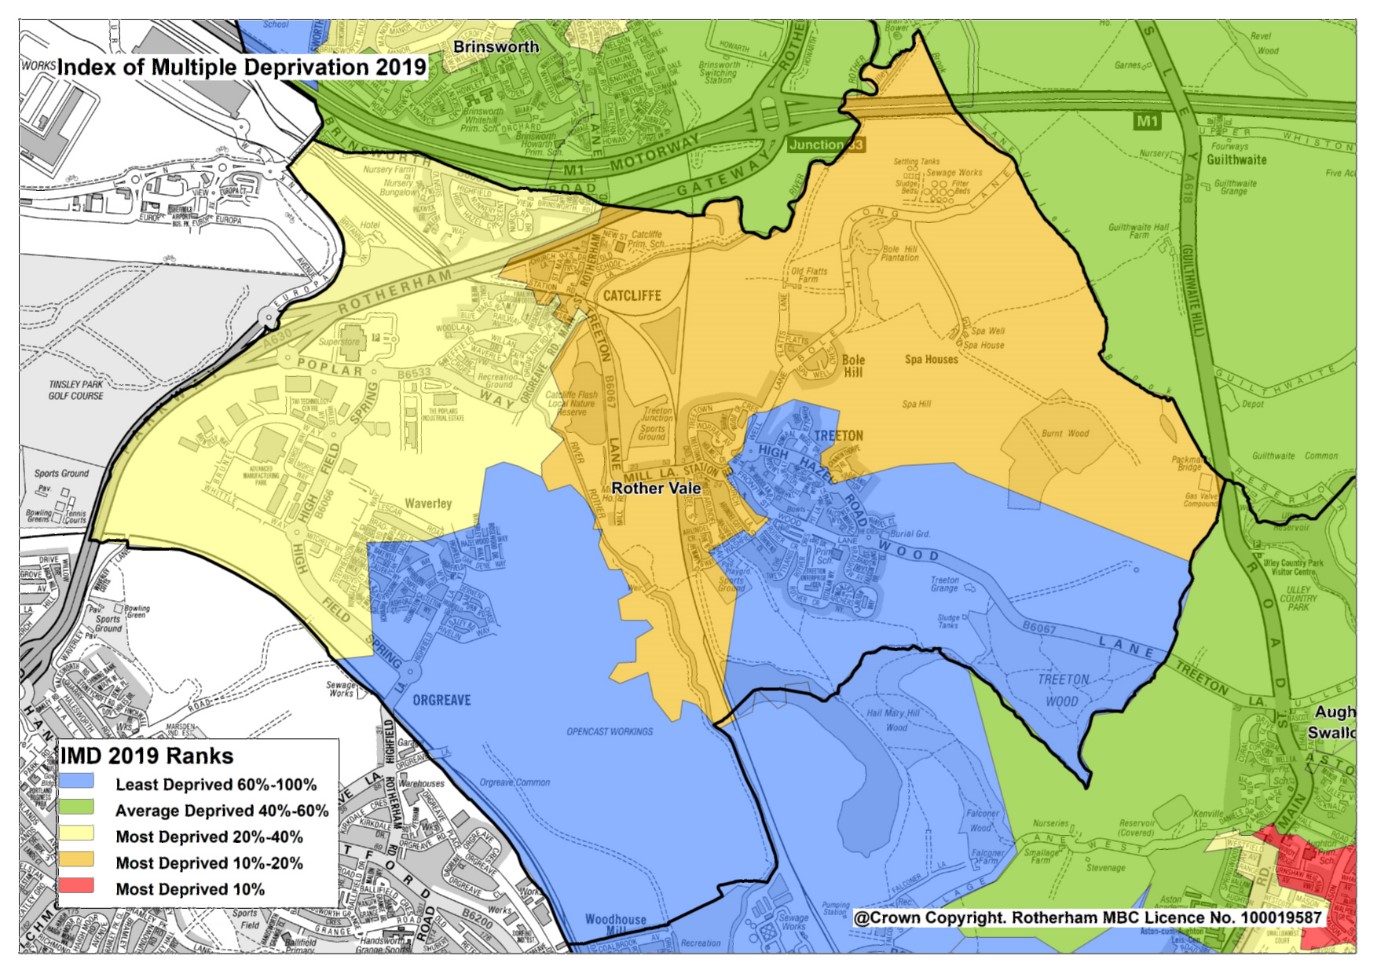
Index of Deprivation
Rother Vale ward has a rank of 17 out of 25 wards in Rotherham and is in Decile 5. Of the 25 wards in Rotherham, 5 are in the top 20% most deprived in the country (deciles 1 and 2). The top 3 most deprived wards in Rotherham are Rotherham East, Dalton & Thrybergh and Maltby East.
Deprivation in Rother Vale ward is below the borough average and in most of the ward is also well below the national average. Although there are no neighbourhoods which are within the most deprived 10% in England, Treeton West neighbourhood fell into the most 20% deprived neighbourhoods in England in 2019.
In Rother Vale ward, the proportion of all children aged 0-15 living in income deprived families is 13.2% and the proportion of those aged 60 or over who experience income deprivation is 18.5%. The ward with the highest proportion of children aged 0-15 living in income deprived families is Dalton & Thrybergh ward at 39.1%. The ward with the highest proportion of those aged 60 and over who experience income deprivation is Rotherham East ward at 36.9%.
Data Sources
Data sources contained within this document include:
Population - ONS Census data via NOMIS Ethnicity - ONS Census data via NOMIS
Religion - ONS Census data via NOMIS
Housing - ONS Census data via NOMIS
Households - ONS Census data via NOMIS
Unemployment claimants aged 16-64 - ONS Claimant Count via NOMIS
Types of employment - Business Register and Employment Survey via NOMIS
General Health - ONS Census data via NOMIS
Disability - ONS Census data via NOMIS
Life expectancy at birth - Public Health England Fingertips
Causes of death - Public Health England Fingertips
Overweight and obesity in children - Public Health England Fingertips
Highest level of education - ONS Census data via NOMIS
Key Stage 2 and Key Stage 4 attainment - RMBC Children & Young People's Services
Index of Multiple Deprivation - Ministry of Housing, Communities and Local Government Community assets map - OpenStreetMap via TomTom/Microsoft Corporation
Access to green space - Green Space Index 2023 commissioned by The Ordinance Survey and undertaken by The Fields in Trust
Crime data - www.police.uk

