Ward profile
Employment, Benefits and Pension
Crime and Anti-social Behaviour
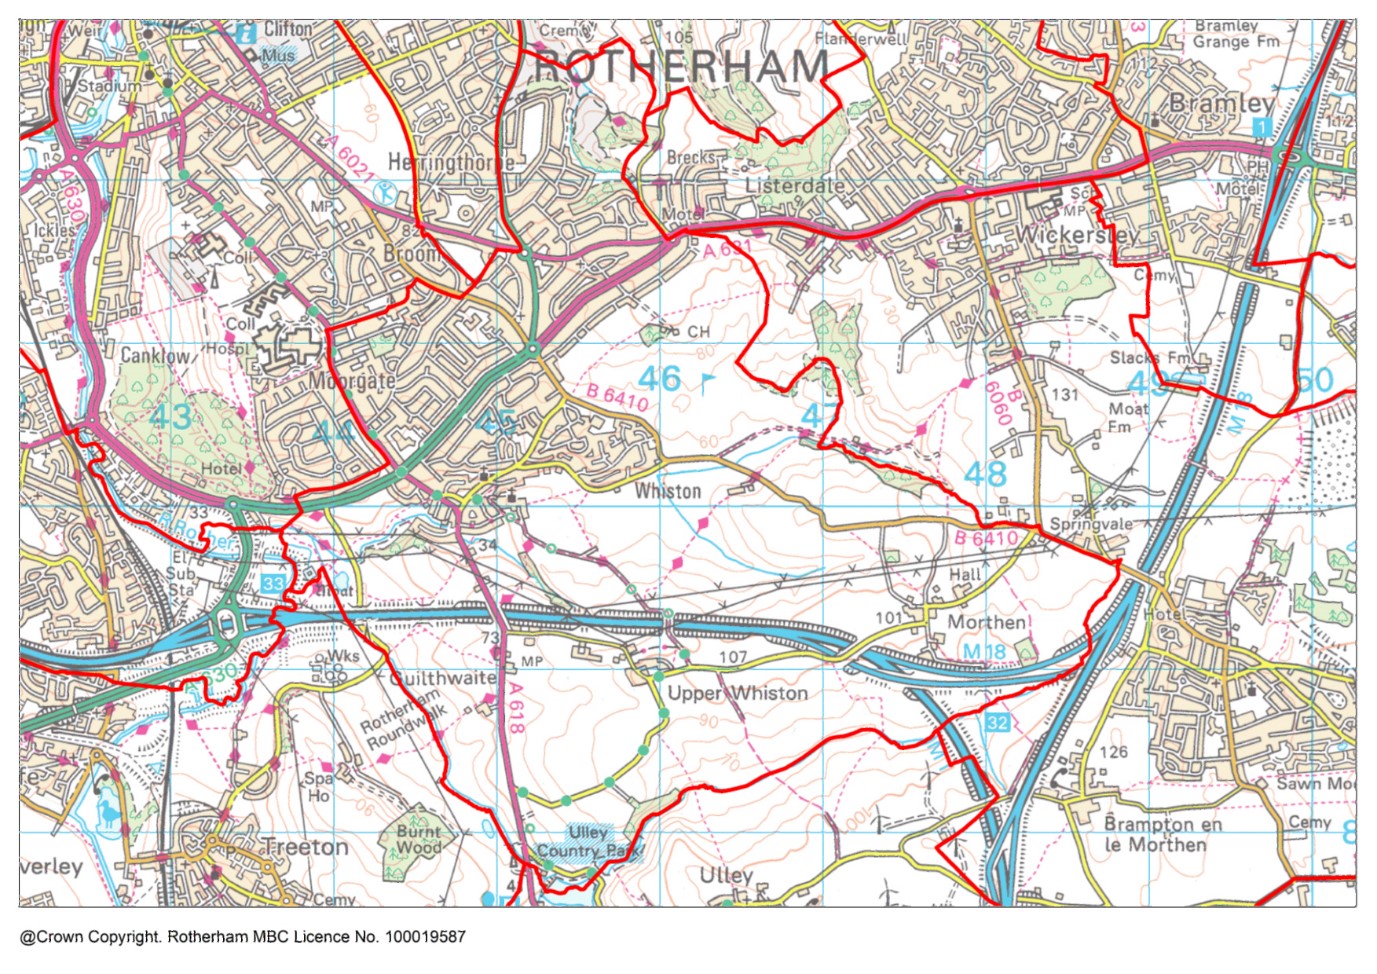
Description
Sitwell Ward lies in the south-central part of the borough, with a population of 12,654 (2021 census).
The ward is represented by three members of the Council.
Sitwell is a mainly suburban ward covering the parish of Whiston (population 4,878) together with parts of the adjacent Rotherham suburbs of Broom, Moorgate, and Stag. These areas are heavily owner occupied.
The south of the ward is rural and very sparsely populated. The hamlets of Morthen, Upper Whiston and Guilthwaite have only 200 residents between them.
Find out more about Sitwell on Rotherham Data Hub
Population by Age
The population of Sitwell ward has reduced since 2011 in contrast to the increasing borough population. The age structure of the population is older than the Rotherham average, with the percentage aged 65+ being well above average.
|
Age |
Ward Population |
Ward Percentage |
Rotherham Percentage |
|
Age 00-15 |
2128 |
16.82 |
18.89 |
|
Age 16-24 |
1122 |
8.87 |
9.60 |
|
Age 25-44 |
2734 |
21.61 |
25.09 |
|
Age 45-64 |
3508 |
27.72 |
26.76 |
|
Age 65+ |
3162 |
24.99 |
19.66 |
|
Total |
12654 |
100.00 |
100.00 |
Ethnicity
Sitwell is the fourth most ethnically diverse ward in Rotherham with over 16% from ethnic minority backgrounds, including 11.4% Asian heritage. The school age population is more diverse, with nearly 30% from ethnic minority communities including 21.4% of Asian heritage.
|
Ethnicity |
Ward % |
Rotherham % |
England % |
|
White British |
83.50 |
88.30 |
74.70 |
|
Asian/Asian British |
11.40 |
5.30 |
9.60 |
|
White Other |
1.60 |
2.80 |
6.30 |
|
Mixed/multiple |
1.50 |
1.40 |
3.00 |
|
Black/Black British |
0.90 |
1.10 |
4.20 |
|
Other |
1.10 |
1.10 |
2.20 |
Housing and Households
otal dwellings (2021 Census) - 5457
Total dwellings (2011 Census) - 5522
Change since 2011 (%) – -1.20
Number of households
Households (2021 Census) - 5256
Households (2011 Census) - 5522
Change since 2011 (%) - -4.80
Population Density (no. of residents per square Kilometre) 2021 Census
Ward – 1005.00
Rotherham - 927.70
Employment, Benefits and Pensionss
In Sitwell ward the total claimant count in July 2023 is 145, which is 2.0% of the working age population. This is lower than the Rotherham average where the claimant count is 4.3% of the working age population.
Sitwell ward has relatively few local jobs although the ward has strengths in several sectors, including education and accommodation and food services. Employment levels in the ward depend on opportunities elsewhere such as Rotherham town centre and the hospital, as local jobs are only sufficient for 28% of working age people.
Health
In Sitwell 45.7% are in very good health, 1.2% are in very bad health. In comparison, in Rotherham 44.2% are in very good health and 1.6% are in very bad health.
According to Census 2021, in Sitwell ward, 18.4% of the population are considered to be disabled under the Equality Act 2010, compared to 21.1% in Rotherham and 17.3% in England. The definition of disability in Census 2021 was: People who assessed their day to day activities as limited by long-term physical or mental health conditions of illnesses are considered disabled. Thus definition of a disabled person meets the harmonised standard for measuring disability and is in line with the Equality Act (2010).
Life expectancy
In the period 2016-2020, Sitwell ward's life expectancy at birth for females is 83.5 years and for males is 80.3 years. This is better than the England average. In comparison, Rotherham's life expectancy for females is 81.3 years and for males is 77.6 years.
Disease and lifestyle
In the 2016-20 time period, the mortality ratio for deaths from strokes in Sitwell ward is 127.7. This is similar to England. In comparison, the lowest mortality ratio for stroke deaths in a Rotherham ward is 56.7 in Aston & Todwick ward and the highest ratio is 185.8 in Rother Vale ward.
In the 2016-20 time period, the mortality ratio for deaths from respiratory disease in Sitwell ward is 136.2. This is worse than England. In comparison, the lowest mortality ratio for deaths from respiratory disease in a Rotherham ward is 79.9 in Bramley & Ravenfield ward and the highest ratio is 209.1 in Rother Vale ward.
In the 2016-20 time period, the mortality ratio for deaths from coronary heart disease in Sitwell ward is 104.7. This is similar to England. In comparison, the lowest mortality ratio for deaths from coronary heart disease in a Rotherham ward is 76.2 in Aston & Todwick ward and the highest ratio is 152.1 in Rotherham East ward.
In the 2016-20 time period, the mortality ratio for deaths from circulatory disease in Sitwell ward is 108.6. This is similar to England. In comparison, the lowest mortality ratio for deaths from circulatory disease in a Rotherham ward is 73.5 in Aston & Todwick ward and the highest ratio is 141.9 in Rother Vale ward.
In the 2016-20 time period, the mortality ratio for deaths from cancer in Sitwell ward is 102.1. This is similar to England. In comparison, the lowest mortality ratio for deaths from cancer in a Rotherham ward is 94.2 in Aston & Todwick ward and the highest ratio is 152.1 in Rother Vale ward.
Obesity
In Sitwell ward (for the time period 2019/20-2021/22) the percentage of children in Reception (aged 4-5 years) classified as overweight or obese is 19.7%. This is better than the England average. The percentage of children classified as obese (including severe obesity) is 9.8%. This is similar to the England average. In Rotherham overall (for comparison) the percentage of children aged 4-5 years classified as overweight or obese is 25.1% and the percentage classified as obese (including severe obesity) is 11.4%.
In Sitwell ward (for the time period 2019/20-2021/22) the percentage of children in Year 6 (aged 10-11 years) classified as overweight or obese is 35.2%. This is better than the England average. The percentage of children classified as obese (including severe obesity) is 22.5%. This is worse than the England average. In Rotherham overall (for comparison) the percentage of children aged 10-11 years classified as overweight or obese is 38.8% and the percentage classified as obese (including severe obesity) is 25.1%.
Education
According to Census 2021, in Sitwell ward 17.6% of residents aged 16 or over have no qualifications, and 30.8% are qualified to level 4 or above. In comparison 23.4% in Rotherham have no qualifications and 23.1% are qualified to level 4 or above.
For Sitwell ward in 2023, there was a total of 150 pupils at the end of key stage 2, of which 6% were disadvantaged compared to 54.5% for Rotherham overall. The percentage of pupils in the ward achieving the expected standard in Reading, Writing and Maths was 58%, compared to 54.5% in Rotherham and 59% nationally.
For Sitwell ward in 2023, there was a total of 145 pupils at the end of key stage 4, of which 4.8% of pupils were disadvantaged, compared to 53.4% in Rotherham overall. The average Attainment 8 score for the ward was 48.7, compared to 43.2 in Rotherham and 46.2 nationally.
Crime and Anti-Social Behaviour (ASB)
Levels of recorded crime and anti-social behaviour in Sitwell ward are lower than the Rotherham average.
In Sitwell ward in 2021 there were a total of 799 recorded crimes. This equates to 63 recorded crimes per 1,000 population compared to 110 per 1,000 population for Rotherham.
In Sitwell ward in 2021, there were a total of 156 recorded incidents of anti-social behaviour. This equates to 12 recorded incidents per 1,000 population, compared to 19 per 1,000 population for Rotherham.
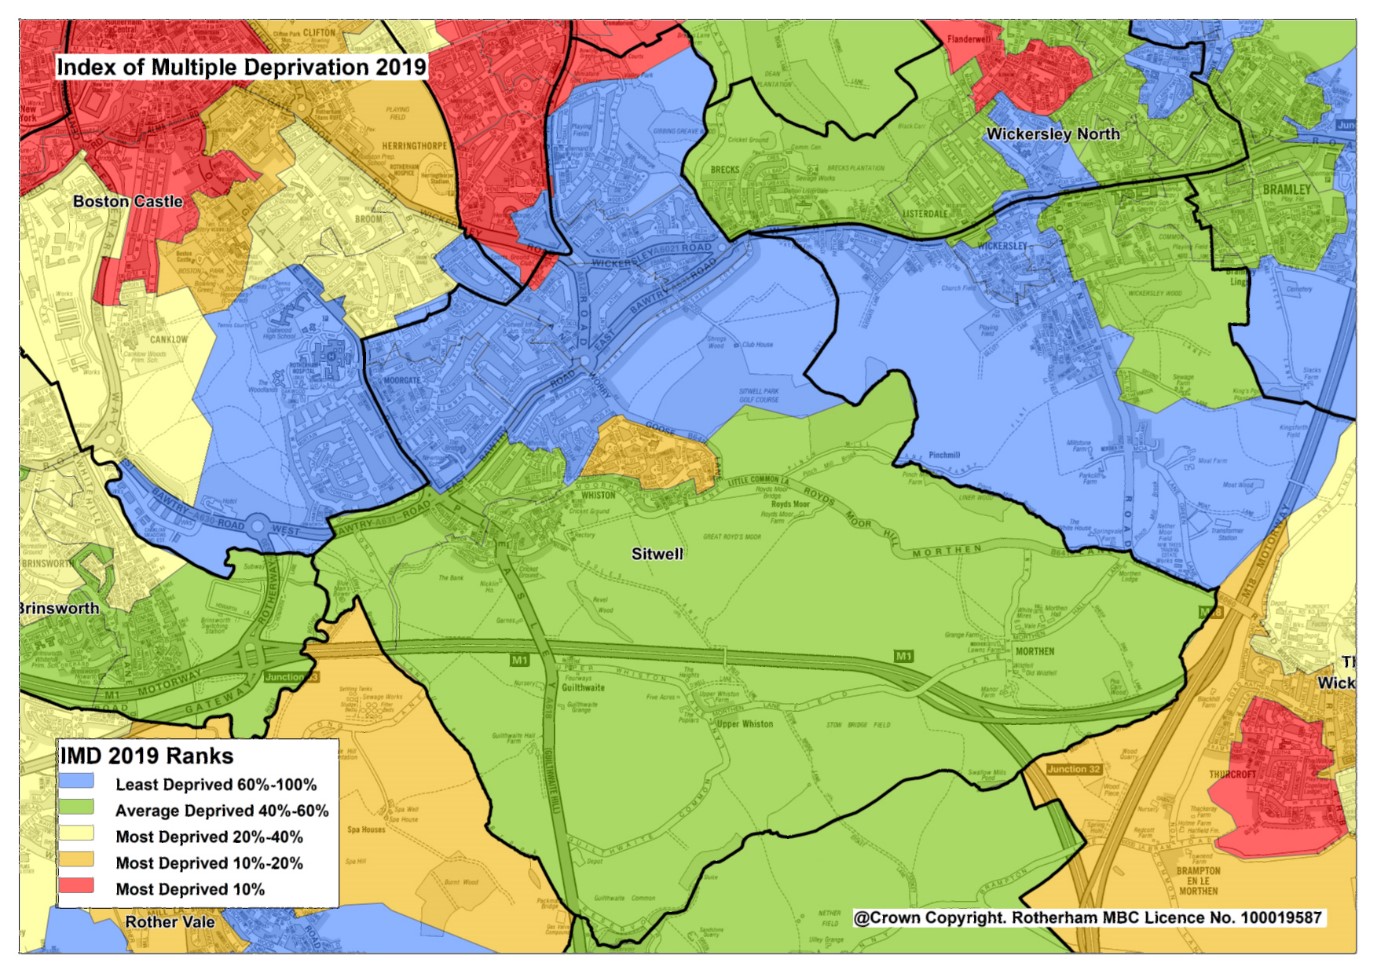
Index of Multiple Deprivation 2015 & 2019
Sitwell ward has a rank of 25 out of 25 wards in Rotherham and is in Decile 6. Of the 25 wards in Rotherham, 5 are in the top 20% most deprived in the country (deciles 1 and 2). The top 3 most deprived wards in Rotherham are Rotherham East, Dalton & Thrybergh and Maltby East.
Deprivation in Sitwell ward is well below the borough average and in most of the ward is also well below the national average. The 3 neighbourhoods of Stag North, Herringthorpe East and Moorgate East are within the 20% least deprived in England, however the neighbourhood of Whiston East is significantly more deprived than other neighbours and part of the most deprived 20% in England.
In Sitwell ward, the proportion of all children aged 0-15 living in income deprived families is 8.1% and the proportion of those aged 60 or over who experience income deprivation is 8.5%. The ward with the highest proportion of children aged 0-15 living in income deprived families is Dalton & Thrybergh ward at 39.1%. The ward with the highest proportion of those aged 60 and over who experience income deprivation is Rotherham East ward at 36.9%.
Data Sources
Data sources contained within this document include:
Population - ONS Census data via NOMIS Ethnicity - ONS Census data via NOMIS
Religion - ONS Census data via NOMIS
Housing - ONS Census data via NOMIS
Households - ONS Census data via NOMIS
Unemployment claimants aged 16-64 - ONS Claimant Count via NOMIS
Types of employment - Business Register and Employment Survey via NOMIS
General Health - ONS Census data via NOMIS
Disability - ONS Census data via NOMIS
Life expectancy at birth - Public Health England Fingertips
Causes of death - Public Health England Fingertips
Overweight and obesity in children - Public Health England Fingertips
Highest level of education - ONS Census data via NOMIS
Key Stage 2 and Key Stage 4 attainment - RMBC Children & Young People's Services
Index of Multiple Deprivation - Ministry of Housing, Communities and Local Government Community assets map - OpenStreetMap via TomTom/Microsoft Corporation
Access to green space - Green Space Index 2023 commissioned by The Ordinance Survey and undertaken by The Fields in Trust
Crime data - www.police.uk

