Ward profile
Employment, Benefits and Pension
Crime and Anti-social Behaviour
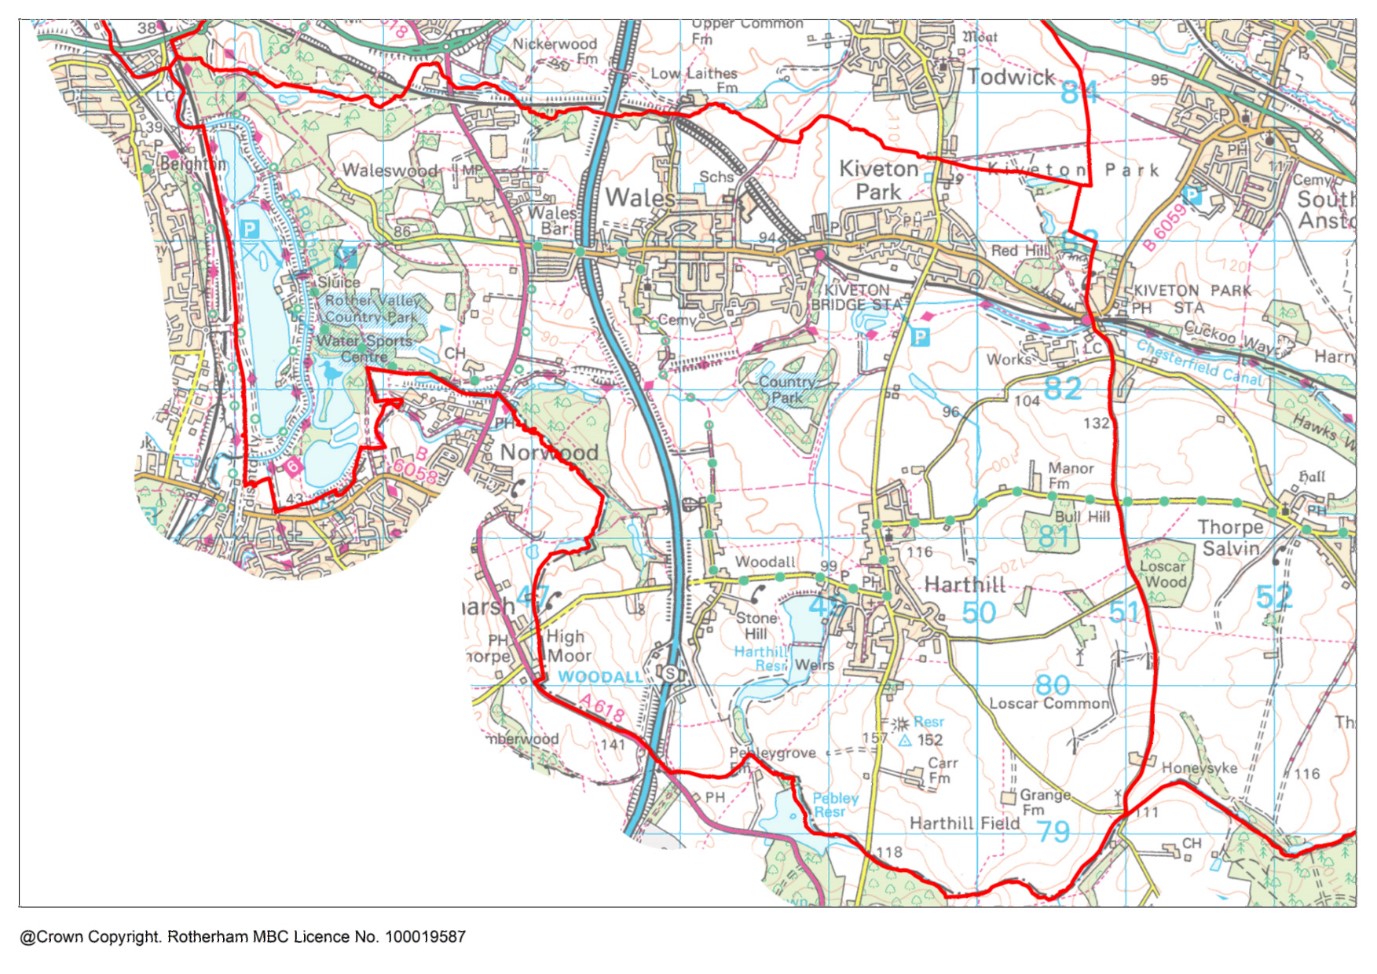
Description
Wales ward lies in the far south of Rotherham Borough, with a population 9,436 (2021 census).
The ward is represented by two members of the Council.
The main parish in the ward is Wales (population 7,510) which combines the twin villages of Wales and Kiveton Park which was once a mining community. In the south is the parish of Harthill with Woodall (population 1,923).
In the far west of the ward is the Rother Valley Country Park which adjoins the location of the Gullivers Valley theme park.
Woodall is well known as the location of a service station on the M1 motorway.
Overall, the ward is not very deprived and contains some affluent areas including Harthill. However, there are some pockets of deprivation in Wales and Kiveton Park.
Kiveton Bridge and Kiveton Park railway stations are situated in the ward.
Find out more about Wales on Rotherham Data Hub
Population by Age
The population of Wales ward has hardly changed since 2011 in contrast to the increasing borough population. The age structure of the population is older than the Rotherham average.
|
Age |
Ward Population |
Ward Percentage |
Rotherham Percentage |
|
Age 00-15 |
1728 |
18.31 |
18.89 |
|
Age 16-24 |
854 |
9.05 |
9.60 |
|
Age 25-44 |
2238 |
23.72 |
25.09 |
|
Age 45-64 |
2633 |
27.90 |
26.76 |
|
Age 65+ |
1983 |
21.02 |
19.66 |
|
Total |
9436 |
100.00 |
100.00 |
Ethnicity
Wales is among the 80% of wards in Rotherham where the white British population exceeds 90%, and the 60% of wards where the 2020 School and Pupil Census shows the white British school age population exceeding 90%.
|
Ethnicity |
Ward % |
Rotherham % |
England % |
|
White British |
95.30 |
88.30 |
74.70 |
|
Asian/Asian British |
1.00 |
5.30 |
9.60 |
|
White Other |
1.70 |
2.80 |
6.30 |
|
Mixed/multiple |
1.20 |
1.40 |
3.00 |
|
Black/Black British |
0.60 |
1.10 |
4.20 |
|
Other |
0.20 |
1.10 |
2.20 |
Housing
Total dwellings (2021 Census) - 4187
Total dwellings (2011 Census) - 4064
Change since 2011 (%) – 3.00
Number of households
Households (2021 Census) - 4063
Households (2011 Census) - 4064
Change since 2011 (%) – 0.00
Population Density (no. of residents per square Kilometre) 2021 Census
Ward – 417.40
Rotherham - 927.70
Employment, Benefits and Pensions
In Wales ward the total claimant count in July 2023 is 135, which is 2.5% of the working age population. This is lower than the Rotherham average where the claimant count is 4.3% of the working age population.
Wales ward has a high proportion of jobs in manufacturing, education and accommodation and food services and relatively few jobs in retail. There is a high proportion of employment in the ward, sufficient to employ 65% of working age residents, although many commute elsewhere.
Health
In Wales 45.4% are in very good health, 1.4% are in very bad health. In comparison, in Rotherham 44.2% are in very good health and 1.6% are in very bad health.
According to Census 2021, in Wales ward, 19.8% of the population are considered to be disabled under the Equality Act 2010, compared to 21.1% in Rotherham and 17.3% in England. The definition of disability in Census 2021 was: People who assessed their day to day activities as limited by long-term physical or mental health conditions of illnesses are considered disabled. Thus definition of a disabled person meets the harmonised standard for measuring disability and is in line with the Equality Act (2010).
Life expectancy
In the period 2016-2020, Wales ward's life expectancy at birth for females is 83.5 years and for males is 79.1 years. This is similar to the England average. In comparison, Rotherham's life expectancy for females is 81.3 years and for males is 77.6 years.
Disease and lifestyle
In the 2016-20 time period, the mortality ratio for deaths from strokes in Wales ward is 69.1. This is similar to England. In comparison, the lowest mortality ratio for stroke deaths in a Rotherham ward is 56.7 in Aston & Todwick ward and the highest ratio is 185.8 in Rother Vale ward.
In the 2016-20 time period, the mortality ratio for deaths from respiratory disease in Wales ward is 118.5. This is similar to England. In comparison, the lowest mortality ratio for deaths from respiratory disease in a Rotherham ward is 79.9 in Bramley & Ravenfield ward and the highest ratio is 209.1 in Rother Vale ward.
In the 2016-20 time period, the mortality ratio for deaths from coronary heart disease in Wales ward is 111.6. This is similar to England. In comparison, the lowest mortality ratio for deaths from coronary heart disease in a Rotherham ward is 76.2 in Aston & Todwick ward and the highest ratio is 152.1 in Rotherham East ward.
In the 2016-20 time period, the mortality ratio for deaths from circulatory disease in Wales ward is 98.4. This is similar to England. In comparison, the lowest mortality ratio for deaths from circulatory disease in a Rotherham ward is 73.5 in Aston & Todwick ward and the highest ratio is 141.9 in Rother Vale ward.
In the 2016-20 time period, the mortality ratio for deaths from cancer in Wales ward is 112.5. This is similar to England. In comparison, the lowest mortality ratio for deaths from cancer in a Rotherham ward is 94.2 in Aston & Todwick ward and the highest ratio is 152.1 in Rother Vale ward.
Obesity
In Wales ward (for the time period 2019/20-2021/22) the percentage of children in Reception (aged 4-5 years) classified as overweight or obese is 24.5%. This is worse than the England average. The percentage of children classified as obese (including severe obesity) is 8.2%. This is better than the England average. In Rotherham overall (for comparison) the percentage of children aged 4-5 years classified as overweight or obese is 25.1% and the percentage classified as obese (including severe obesity) is 11.4%.
In Wales ward (for the time period 2019/20-2021/22) the percentage of children in Year 6 (aged 10-11 years) classified as overweight or obese is 31.4%. This is better than the England average. The percentage of children classified as obese (including severe obesity) is 21.4%. This is similar to the England average. In Rotherham overall (for comparison) the percentage of children aged 10-11 years classified as overweight or obese is 38.8% and the percentage classified as obese (including severe obesity) is 25.1%.
Education
According to Census 2021, in Wales ward 19.8% of residents aged 16 or over have no qualifications, and 25.4% are qualified to level 4 or above. In comparison 23.4% in Rotherham have no qualifications and 23.1% are qualified to level 4 or above.
For Wales ward in 2023, there was a total of 116 pupils at the end of key stage 2, of which 17.2% were disadvantaged compared to 54.5% for Rotherham overall. The percentage of pupils in the ward achieving the expected standard in Reading, Writing and Maths was 57.8%, compared to 54.5% in Rotherham and 59% nationally.
For Wales ward in 2023, there was a total of 125 pupils at the end of key stage 4, of which 15.2% of pupils were disadvantaged, compared to 53.4% in Rotherham overall. The average Attainment 8 score for the ward was 47.8, compared to 43.2 in Rotherham and 46.2 nationally.
Crime and Anti-Social Behaviour (ASB)
Levels of recorded crime and anti-social behavior in Wales ward are lower than the Rotherham average.
In Wales ward in 2021 there were a total of 651 recorded crimes. This equates to 69 recorded crimes per 1,000 population compared to 110 per 1,000 population for Rotherham.
In Wales ward in 2021, there were a total of 126 recorded incidents of anti-social behaviour. This equates to 13 recorded incidents per 1,000 population, compared to 19 per 1,000 population for Rotherham.
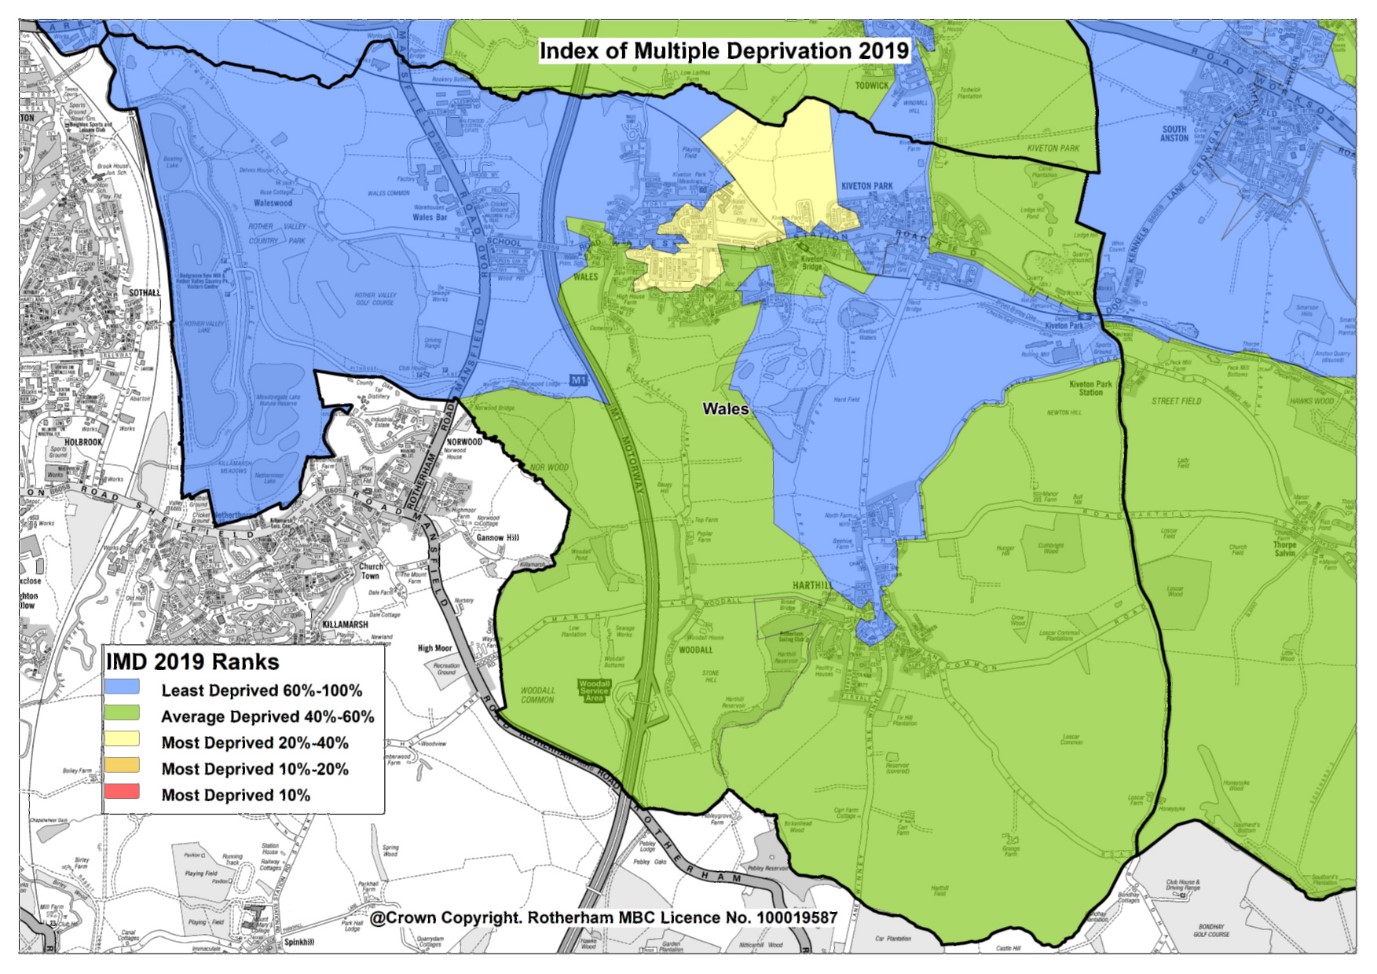
Index of Multiple Deprivation 2015 & 2019
Wales ward has a rank of 21 out of 25 wards in Rotherham and is in Decile 6. Of the 25 wards in Rotherham, 5 are in the top 20% most deprived in the country (deciles 1 and 2). The top 3 most deprived wards in Rotherham are Rotherham East, Dalton & Thrybergh and Maltby East.
Deprivation in Wales ward is well below the borough average and in most of the ward is also well below the national average. There are no neighbourhoods that fall within the most deprived 10% in England, however Wales East neighbourhood is more deprived than other areas within the borough.
In Wales ward, the proportion of all children aged 0-15 living in income deprived families is 12.2% and the proportion of those aged 60 or over who experience income deprivation is 10.8%. The ward with the highest proportion of children aged 0-15 living in income deprived families is Dalton & Thrybergh ward at 39.1%. The ward with the highest proportion of those aged 60 and over who experience income deprivation is Rotherham East ward at 36.9%.
Data Sources
Data sources contained within this document include:
Population - ONS Census data via NOMIS Ethnicity - ONS Census data via NOMIS
Religion - ONS Census data via NOMIS
Housing - ONS Census data via NOMIS
Households - ONS Census data via NOMIS
Unemployment claimants aged 16-64 - ONS Claimant Count via NOMIS
Types of employment - Business Register and Employment Survey via NOMIS
General Health - ONS Census data via NOMIS
Disability - ONS Census data via NOMIS
Life expectancy at birth - Public Health England Fingertips
Causes of death - Public Health England Fingertips
Overweight and obesity in children - Public Health England Fingertips
Highest level of education - ONS Census data via NOMIS
Key Stage 2 and Key Stage 4 attainment - RMBC Children & Young People's Services
Index of Multiple Deprivation - Ministry of Housing, Communities and Local Government Community assets map - OpenStreetMap via TomTom/Microsoft Corporation
Access to green space - Green Space Index 2023 commissioned by The Ordinance Survey and undertaken by The Fields in Trust
Crime data - www.police.uk

