Ward profile
Employment, Benefits and Pension
Crime and Anti-social Behaviour
Description
Rotherham East lies in the central part of Rotherham, with a population of 16,757 (2021 census).
The ward is represented by three members of the Council.
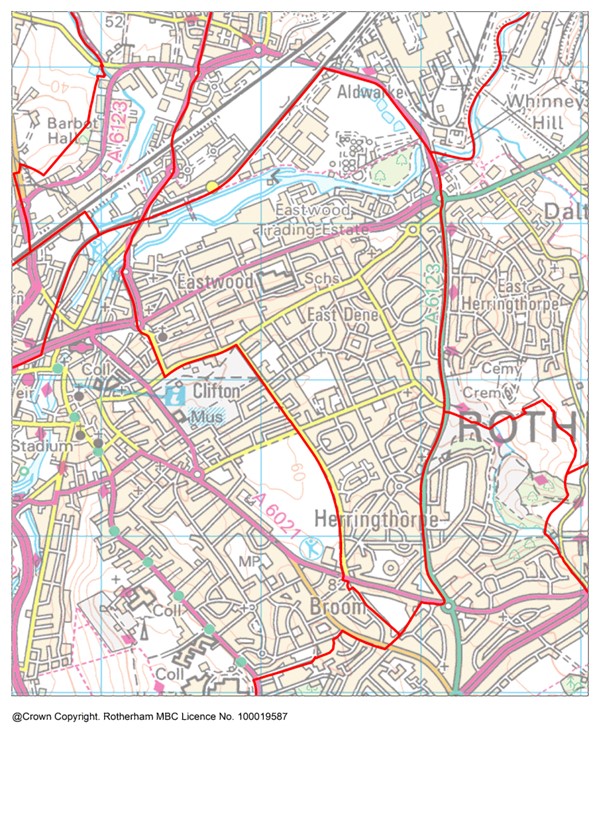
Rotherham East is a compact urban ward, combining several residential areas to the east of Rotherham Town Centre.
The neighbourhoods included are Eastwood, Springwell Gardens, East Dene, parts of Clifton and Herringthorpe (mainly council housing).
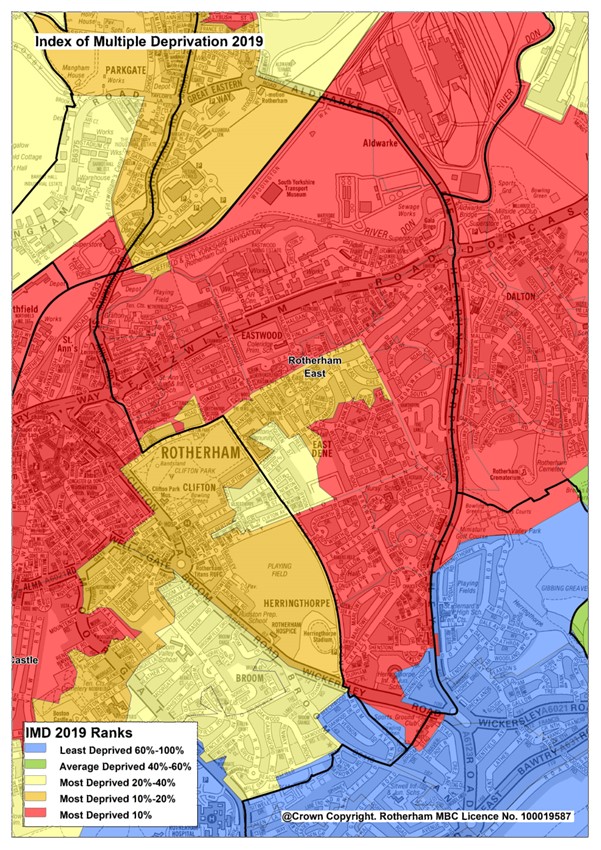
The ward is the most deprived in Rotherham, with almost all neighbourhoods affected (see Index of Multiple Deprivation).
Eastwood Village is a multi-ethnic area with much private rented terraced housing.
East Dene is mainly council housing although many homes are now privately owned.
Clifton has older private housing, mainly terraced.
In the north of the ward is the Eastwood Trading Estate although most people rely on the nearby town centre for work.
Find out more about Rotherham East on Rotherham Data Hub
Population by Age
The population of Rotherham East ward has remained stable since 2011, in contrast to the increase in the borough population overall. The age structure of the population is significantly younger than the Rotherham average, the percentage of children aged 0-15 is well above average, and the percentage of older people aged 65+ well below average.
|
Age |
Ward Population |
Ward Percentage |
Rotherham Percentage |
|
Age 00-15 |
4056 |
24.20 |
18.89 |
|
Age 16-24 |
1887 |
11.26 |
9.60 |
|
Age 25-44 |
4681 |
27.93 |
25.09 |
|
Age 45-64 |
3880 |
23.15 |
26.76 |
|
Age 65+ |
2253 |
13.45 |
19.66 |
|
Total |
16757 |
100.00 |
100.00 |
Ethnicity
Rotherham East is the second most ethnically diverse ward in Rotherham with over 35% from ethnic minority backgrounds, including over 18% Asian heritage. Non-British white make up 7.5%. The school age population is more diverse, with over half of pupils from ethnic minority communities. This includes 23% of Asian heritage. Non-British white, at over 15% is the highest for any Rotherham ward.
|
Ethnicity |
Ward % |
Rotherham % |
England % |
|
White British |
63.40 |
88.30 |
74.70 |
|
Asian/Asian British |
18.90 |
5.30 |
9.60 |
|
White Other |
7.60 |
2.80 |
6.30 |
|
Mixed/multiple |
2.40 |
1.40 |
3.00 |
|
Black/Black British |
3.00 |
1.10 |
4.20 |
|
Other |
4.70 |
1.10 |
2.20 |
Housing
Total dwellings (2021 Census) - 7057
Total dwellings (2011 Census) - 6498
Change since 2011 (%) – 8.60
Number of households
Households (2021 Census) - 6627
Households (2011 Census) - 6498
Change since 2011 (%) – 2.00
Population Density (no. of residents per square Kilometre) 2021 Census
Ward – 4329.60
Rotherham - 927.70
Employment, Benefits and Pensions
In Rotherham East ward the total claimant count in July 2023 is 1035, which is 9.6% of the working age population. This is higher than the Rotherham average where the claimant count is 4.3% of the working age population.
Rotherham East ward has a high proportion of employment in education, and also manufacturing and production activities - mainly in the Eastwood Trading Estate. The ward only has enough jobs for 42% of local working age residents, depending heavily on employment in neighbouring wards.
Health
In Rotherham East 42.4% are in very good health, 2.4% are in very bad health. In comparison, in Rotherham 44.3% are in very good health and 1.6% are in very bad health.
According to Census 2021, in Rotherham East ward, 23% of the population are considered to be disabled under the Equality Act 2010, compared to 21.1% in Rotherham and 17.3% in England. The definition of disability in Census 2021 was: People who assessed their day to day activities as limited by long-term physical or mental health conditions of illnesses are considered disabled. Thus definition of a disabled person meets the harmonised standard for measuring disability and is in line with the Equality Act (2010).
Life expectancy
In the period 2016-2020, Rotherham East ward's life expectancy at birth for females is 78 years and for males is 74.9 years. This is worse than the England average. In comparison, Rotherham's life expectancy for females is 81.3 years and for males is 77.6 years.
Disease and lifestyle
In the 2016-20 time period, the mortality ratio for deaths from strokes in Rotherham East ward is 109.6. This is similar to England. In comparison, the lowest mortality ratio for stroke deaths in a Rotherham ward is 56.7 in Aston & Todwick ward and the highest ratio is 185.8 in Rother Vale ward.
In the 2016-20 time period, the mortality ratio for deaths from respiratory disease in Rotherham East ward is 183.3. This is worse than England. In comparison, the lowest mortality ratio for deaths from respiratory disease in a Rotherham ward is 79.9 in Bramley & Ravenfield ward and the highest ratio is 209.1 in Rother Vale ward.
In the 2016-20 time period, the mortality ratio for deaths from coronary heart disease in Rotherham East ward is 152.1. This is worse than England and is the highest ratio of any ward in Rotherham. In comparison, the lowest mortality ratio for deaths from coronary heart disease in a Rotherham ward is 76.2 in Aston & Todwick.
In the 2016-20 time period, the mortality ratio for deaths from circulatory disease in Rotherham East ward is 133.4. This is worse than England. In comparison, the lowest mortality ratio for deaths from circulatory disease in a Rotherham ward is 73.5 in Aston & Todwick ward and the highest ratio is 141.9 in Rother Vale ward.
In the 2016-20 time period, the mortality ratio for deaths from cancer in Rotherham East ward is 125.8. This is worse than England. In comparison, the lowest mortality ratio for deaths from cancer in a Rotherham ward is 94.2 in Aston & Todwick ward and the highest ratio is 152.1 in Rother Vale ward.
Obesity
In Rotherham East ward (for the time period 2019/20-2021/22) the percentage of children in Reception (aged 4-5 years) classified as overweight or obese is 27.7%. This is worse than the England average. The percentage of children classified as obese (including severe obesity) is 14.9%. This is worse than the England average. In Rotherham overall (for comparison) the percentage of children aged 4-5 years classified as overweight or obese is 25.1% and the percentage classified as obese (including severe obesity) is 11.4%.
In Rotherham East ward (for the time period 2019/20-2021/22) the percentage of children in Year 6 (aged 10-11 years) classified as overweight or obese is 44.1%. This is worse than the England average. The percentage of children classified as obese (including severe obesity) is 31%. This is worse than the England average. In Rotherham overall (for comparison) the percentage of children aged 10-11 years classified as overweight or obese is 38.8% and the percentage classified as obese (including severe obesity) is 25.1%.
Education
According to Census 2021, in Rotherham East ward 36.8% of residents aged 16 or over have no qualifications, and 15.4% are qualified to level 4 or above. In comparison 23.4% in Rotherham have no qualifications and 23.1% are qualified to level 4 or above.
For Rotherham East ward in 2023, there was a total of 288 pupils at the end of key stage 2, of which 100% were disadvantaged compared to 54.5% for Rotherham overall. The percentage of pupils in the ward achieving the expected standard in Reading, Writing and Maths was 46.9%, compared to 54.5% in Rotherham and 59% nationally.
For Rotherham East ward in 2023, there was a total of 233 pupils at the end of key stage 4, of which 100% of pupils were disadvantaged, compared to 53.4% in Rotherham overall. The average Attainment 8 score for the ward was 37.8, compared to 43.2 in Rotherham and 46.2 nationally.
Crime and Anti-Social Behaviour (ASB)
Levels of recorded crime and anti-social behaviour in Rotherham East ward are higher than the Rotherham average.
In Rotherham East ward in 2021 there were a total of 2,286 recorded crimes. This equates to 136 recorded crimes per 1,000 population compared to 110 per 1,000 population for Rotherham.
In Rotherham East ward in 2021, there were a total of 311 recorded incidents of anti-social behaviour. This equates to 19 recorded incidents per 1,000 population, compared to 19 per 1,000 population for Rotherham.
Index of Multiple Deprivation 2015 & 2019
Rotherham East ward has a rank of 1 out of 25 wards in Rotherham and is in Decile 1. Of the 25 wards in Rotherham, 5 are in the top 20% most deprived in the country (deciles 1 and 2). The top 3 most deprived wards in Rotherham are Rotherham East, Dalton & Thrybergh and Maltby East.
Deprivation in Rotherham East ward is well above the borough average and the whole ward is well above national average. All neighbourhoods (with the exception of East Dene North West) are within the most deprived 10% of England.
In Rotherham East ward, the proportion of all children aged 0-15 living in income deprived families is 37.6% and the proportion of those aged 60 or over who experience income deprivation is 36.9%. The ward with the highest proportion of children aged 0-15 living in income deprived families is Dalton & Thrybergh ward at 39.1%. Rotherham East ward has the highest proportion of those aged 60 and over who experience income deprivation.
Data Sources
Data sources contained within this document include:
Population - ONS Census data via NOMIS Ethnicity - ONS Census data via NOMIS
Religion - ONS Census data via NOMIS
Housing - ONS Census data via NOMIS
Households - ONS Census data via NOMIS
Unemployment claimants aged 16-64 - ONS Claimant Count via NOMIS
Types of employment - Business Register and Employment Survey via NOMIS
General Health - ONS Census data via NOMIS
Disability - ONS Census data via NOMIS
Life expectancy at birth - Public Health England Fingertips
Causes of death - Public Health England Fingertips
Overweight and obesity in children - Public Health England Fingertips
Highest level of education - ONS Census data via NOMIS
Key Stage 2 and Key Stage 4 attainment - RMBC Children & Young People's Services
Index of Multiple Deprivation - Ministry of Housing, Communities and Local Government Community assets map - OpenStreetMap via TomTom/Microsoft Corporation
Access to green space - Green Space Index 2023 commissioned by The Ordinance Survey and undertaken by The Fields in Trust
Crime data - www.police.uk

