Ward profile
Employment, Benefits and Pension
Crime and Anti-social Behaviour
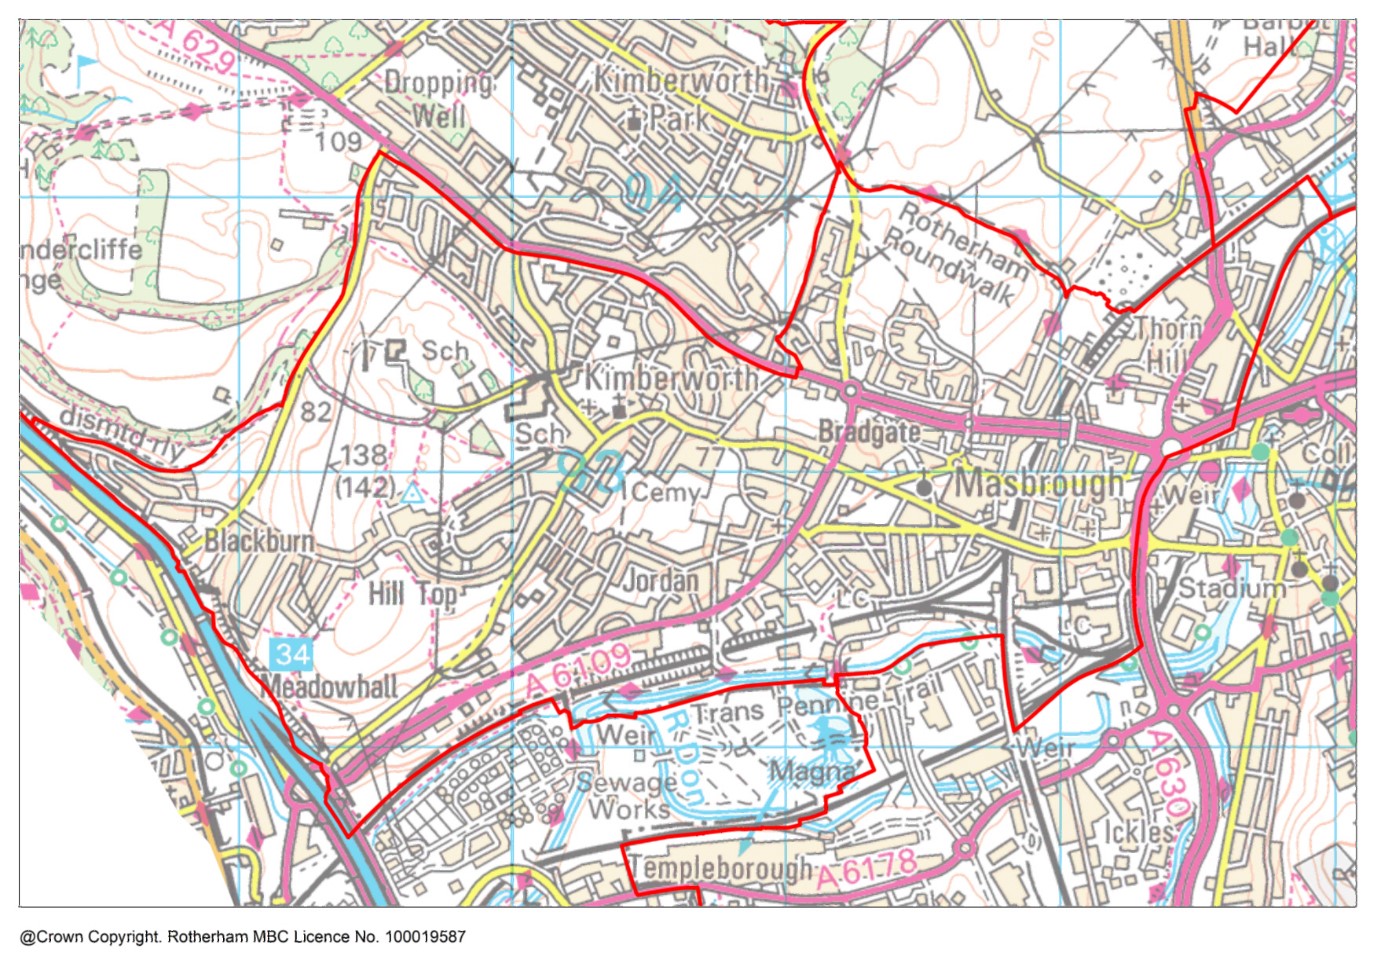
Description
Rotherham West lies in the west central part of Rotherham, with a population of 14,623 (2021 census).
The ward is represented by three members of the Council.
Rotherham West extends west from the town centre at Centenery Way, through the inner urban neighbourhoods of Masbrough, Ferham, Bradgate and Meadow Bank to more suburban areas at Kimberworth, Hill Top and Blackburn.
Masbrough and Ferham have high minority ethnic populations, much terraced housing and high levels of deprivation. Private semi-detached housing predominates in the western part of the ward such as Kimberworth.
Most of the ward is residential but there are industrial areas in the south by the canal and east close to the town centre.
Find out more about Rotherham West on Rotherham Data Hub
Population by Age
The population of Rotherham West ward has not changed since 2011, contrast to the small increase in borough average overall. The age structure of the population is younger than the Rotherham average, with the percentage of residents aged 65+ being well below average.
|
Age |
Ward Population |
Ward Percentage |
Rotherham Percentage |
|
Age 00-15 |
2847 |
19.47 |
18.89 |
|
Age 16-24 |
1636 |
11.19 |
9.60 |
|
Age 25-44 |
3931 |
26.88 |
25.09 |
|
Age 45-64 |
3790 |
25.92 |
26.76 |
|
Age 65+ |
2419 |
16.54 |
19.66 |
|
Total |
14623 |
100.00 |
100.00 |
Ethnicity
Rotherham West is the third most ethnically diverse ward in Rotherham with almost 27% from ethnic minority backgrounds, including over 13% Asian heritage. Non-British white make up 6.5%. The school age population is more diverse, with 45% from ethnic minority communities. This includes nearly 23% of Asian heritage.
|
Ethnicity |
Ward % |
Rotherham % |
England % |
|
White British |
73.30 |
88.30 |
74.70 |
|
Asian/Asian British |
13.40 |
5.30 |
9.60 |
|
White Other |
6.50 |
2.80 |
6.30 |
|
Mixed/multiple |
1.80 |
1.40 |
3.00 |
|
Black/Black British |
2.00 |
1.10 |
4.20 |
|
Other |
3.00 |
1.10 |
2.20 |
Housing and Households
Total dwellings (2021 Census) - 6707
Total dwellings (2011 Census) - 6012
Change since 2011 (%) – 11.60
Number of households
Households (2021 Census) - 6218
Households (2011 Census) - 6012
Change since 2011 (%) – 3.40
Population Density (no. of residents per square Kilometre) 2021 Census
Ward – 2517.30
Rotherham - 927.70
Employment, Benefits and Pensions
In Rotherham West ward the total claimant count in July 2023 is 710, which is 7.3% of the working age population. This is higher than the Rotherham average where the claimant count is 4.3% of the working age population.
Rotherham West ward has a high proportion of employment in health, manufacturing, and education. The ward has employment for 67% of its working age residents, meaning, a large proportion of residents seek employment opportunities elsewhere.
Health
In Rotherham West 42.8% are in very good health, 1.6% are in very bad health. In comparison, in Rotherham 44.2% are in very good health and 1.6% are in very bad health.
According to Census 2021, in Rotherham West ward, 20.3% of the population are considered to be disabled under the Equality Act 2010, compared to 21.1% in Rotherham and 17.3% in England. The definition of disability in Census 2021 was: People who assessed their day to day activities as limited by long-term physical or mental health conditions of illnesses are considered disabled. Thus definition of a disabled person meets the harmonised standard for measuring disability and is in line with the Equality Act (2010).
Life expectancy
In the period 2016-2020, Rotherham West ward's life expectancy at birth for females is 81 years and for males is 77.9 years. This is worse than the England average. In comparison, Rotherham's life expectancy for females is 81.3 years and for males is 77.6 years.
Disease and lifestyle
In the 2016-20 time period, the mortality ratio for deaths from strokes in Rotherham West ward is 96. This is similar to England. In comparison, the lowest mortality ratio for stroke deaths in a Rotherham ward is 56.7 in Aston & Todwick ward and the highest ratio is 185.8 in Rother Vale ward.
In the 2016-20 time period, the mortality ratio for deaths from respiratory disease in Rotherham West ward is 127.7. This is worse than England. In comparison, the lowest mortality ratio for deaths from respiratory disease in a Rotherham ward is 79.9 in Bramley & Ravenfield ward and the highest ratio is 209.1 in Rother Vale ward.
In the 2016-20 time period, the mortality ratio for deaths from coronary heart disease in Rotherham West ward is 102.4. This is similar to England. In comparison, the lowest mortality ratio for deaths from coronary heart disease in a Rotherham ward is 76.2 in Aston & Todwick ward and the highest ratio is 152.1 in Rotherham East ward.
In the 2016-20 time period, the mortality ratio for deaths from circulatory disease in Rotheham West ward is 105.3. This is similar to England. In comparison, the lowest mortality ratio for deaths from circulatory disease in a Rotherham ward is 73.5 in Aston & Todwick ward and the highest ratio is 141.9 in Rother Vale ward.
In the 2016-20 time period, the mortality ratio for deaths from cancer in Rotherham West ward is 110.4. This is similar to England. In comparison, the lowest mortality ratio for deaths from cancer in a Rotherham ward is 94.2 in Aston & Todwick ward and the highest ratio is 152.1 in Rother Vale ward.
Obesity
In Rotherham West ward (for the time period 2019/20-2021/22) the percentage of children in Reception (aged 4-5 years) classified as overweight or obese is 32.3%. This is worse than the England average. The percentage of children classified as obese (including severe obesity) is 13.1%. This is worse than the England average. In Rotherham overall (for comparison) the percentage of children aged 4-5 years classified as overweight or obese is 25.1% and the percentage classified as obese (including severe obesity) is 11.4%.
In Rotherham West ward (for the time period 2019/20-2021/22) the percentage of children in Year 6 (aged 10-11 years) classified as overweight or obese is 47.2%. This is worse than the England average. The percentage of children classified as obese (including severe obesity) is 34.3%. This is worse than the England average. In Rotherham overall (for comparison) the percentage of children aged 10-11 years classified as overweight or obese is 38.8% and the percentage classified as obese (including severe obesity) is 25.1%.
Education
According to Census 2021, in Rotherham West ward 26.8% of residents aged 16 or over have no qualifications, and 19.3% are qualified to level 4 or above. In comparison 23.4% in Rotherham have no qualifications and 23.1% are qualified to level 4 or above.
For Rotherham West ward in 2023, there was a total of 210 pupils at the end of key stage 2, of which 88.1% were disadvantaged compared to 54.5% for Rotherham overall. The percentage of pupils in the ward achieving the expected standard in Reading, Writing and Maths was 45.2%, compared to 54.5% in Rotherham and 59% nationally.
For Rotherham West ward in 2023, there was a total of 161 pupils at the end of key stage 4, of which 87.6% of pupils were disadvantaged, compared to 53.4% in Rotherham overall. The average Attainment 8 score for the ward was 42.7, compared to 43.2 in Rotherham and 46.2 nationally.
Crime and Anti-Social Behaviour (ASB)
Levels of recorded crime and anti-social behaviour in Rotherham West ward are higher than the Rotherham average.
In Rotherham West ward in 2021 there were a total of 2,218 recorded crimes. This equates to 152 recorded crimes per 1,000 population compared to 110 per 1,000 population for Rotherham.
In Rotherham West ward in 2021, there were a total of 357 recorded incidents of anti-social behaviour. This equates to 24 recorded incidents per 1,000 population, compared to 19 per 1,000 population for Rotherham.
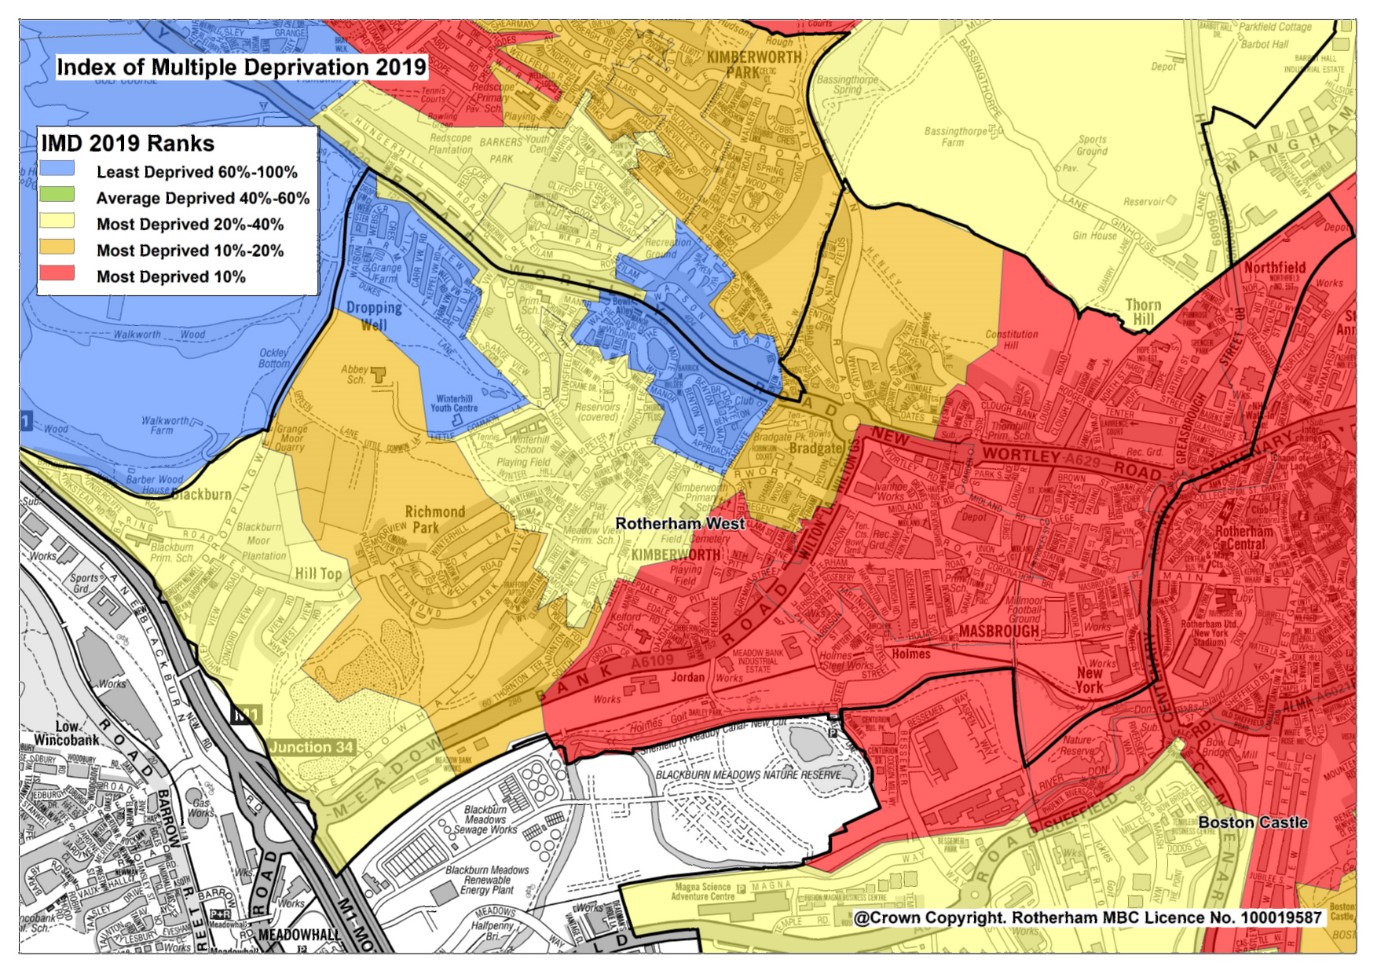
Index of Multiple Deprivation 2015 & 2019
Rotherham West ward has a rank of 6 out of 25 wards in Rotherham and is in Decile 3. Of the 25 wards in Rotherham, 5 are in the top 20% most deprived in the country (deciles 1 and 2). The top 3 most deprived wards in Rotherham are Rotherham East, Dalton & Thrybergh and Maltby East.
Deprivation in Rotherham West ward is well above the borough average and in most of the ward is also well above the national average. The neighbourhoods of Ferham, Masbrough, and Meadowbank are within the most deprived 10% of England, whilst Bradgate and Richmond Park are within the 20% most deprived nationally.
In Rotherham West ward, the proportion of all children aged 0-15 living in income deprived families is 26.9% and the proportion of those aged 60 or over who experience income deprivation is 19.0%. The ward with the highest proportion of children aged 0-15 living in income deprived families is Dalton & Thrybergh ward at 39.1%. The ward with the highest proportion of those aged 60 and over who experience income deprivation is Rotherham East ward at 36.9%.
Data Sources
Data sources contained within this document include:
Population - ONS Census data via NOMIS Ethnicity - ONS Census data via NOMIS
Religion - ONS Census data via NOMIS
Housing - ONS Census data via NOMIS
Households - ONS Census data via NOMIS
Unemployment claimants aged 16-64 - ONS Claimant Count via NOMIS
Types of employment - Business Register and Employment Survey via NOMIS
General Health - ONS Census data via NOMIS
Disability - ONS Census data via NOMIS
Life expectancy at birth - Public Health England Fingertips
Causes of death - Public Health England Fingertips
Overweight and obesity in children - Public Health England Fingertips
Highest level of education - ONS Census data via NOMIS
Key Stage 2 and Key Stage 4 attainment - RMBC Children & Young People's Services
Index of Multiple Deprivation - Ministry of Housing, Communities and Local Government Community assets map - OpenStreetMap via TomTom/Microsoft Corporation
Access to green space - Green Space Index 2023 commissioned by The Ordinance Survey and undertaken by The Fields in Trust
Crime data - www.police.uk

