Ward profile
Employment, Benefits and Pension
Crime and Anti-social Behaviour
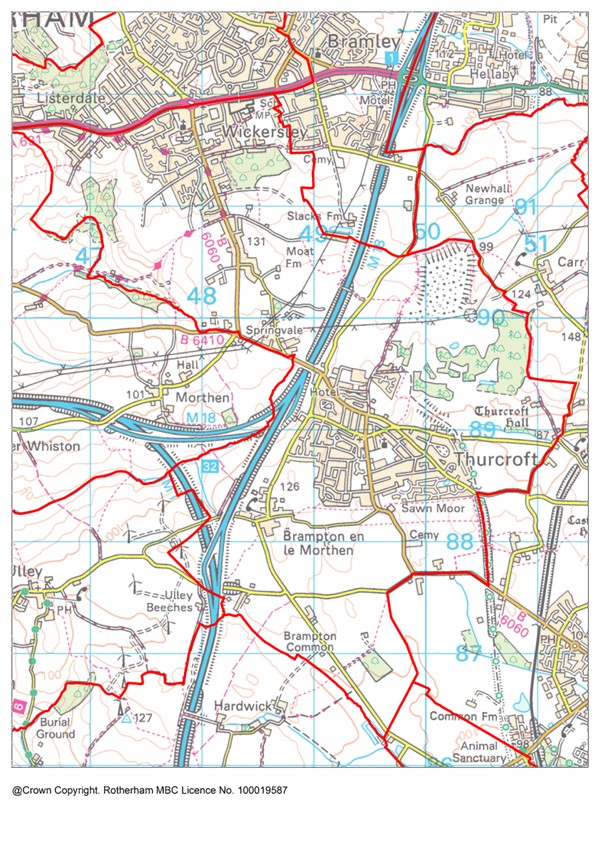
Description
Thurcroft and Wickersley South ward lies in the south-centre of Rotherham with a population of 10,042 (2021 census).
The ward is represented by two members of the Council.
In the north of the ward, within Wickersley South, is Bawtry Road.
The south of the ward is largely rural with population located in Thurcroft and Brampton en le Morthen.
The ward is served by the Thurcroft North ward of Thurcroft parish (total parish population 7,908) council and the Wickersley South ward of Wickersley parish (total parish population 8,290) council.
Find out more about Thurcroft and Wickersley South on Rotherham Data Bank
Population by Age
The population of Thurcroft & Wickersley South ward has increased at a similar rate to the borough average since 2011. The age structure of the population is similar to the Rotherham average, although the percentage aged 65+ is above average.
|
Age |
Ward Population |
Ward Percentage |
Rotherham Percentage |
|
Age 00-15 |
1937 |
19.29 |
18.89 |
|
Age 16-24 |
862 |
8.58 |
9.60 |
|
Age 25-44 |
2437 |
24.27 |
25.09 |
|
Age 45-64 |
2552 |
25.41 |
26.76 |
|
Age 65+ |
2254 |
22.45 |
19.66 |
|
Total |
10042 |
100.00 |
100.00 |
Ethnicity
Thurcroft and Wickersley is among the 80% of wards in Rotherham where the white British population exceeds 90%, and the 60% of wards where the 2020 School and Pupil Census shows the white British school age population exceeding 90%.
|
Ethnicity |
Ward % |
Rotherham % |
England % |
|
White British |
94.30 |
88.30 |
74.70 |
|
Asian/Asian British |
1.90 |
5.30 |
9.60 |
|
White Other |
1.60 |
2.80 |
6.30 |
|
Mixed/multiple |
1.00 |
1.40 |
3.00 |
|
Black/Black British |
0.80 |
1.10 |
4.20 |
|
Other |
0.30 |
1.10 |
2.20 |
Housing and Households
Total dwellings (2021 Census) - 4559
Total dwellings (2011 Census) - 4248
Change since 2011 (%) – 7.30
Number of households
Households (2021 Census) - 4339
Households (2011 Census) - 4248
Change since 2011 (%) – 2.10
Population Density (no. of residents per square Kilometre) 2021 Census
Ward – 805.60
Rotherham - 927.70
Employment, Benefits and Pensions
In Thurcroft & Wickersley South ward the total claimant count in July 2023 is 160, which is 2.9% of the working age population. This is lower than the Rotherham average where the claimant count is 4.3% of the working age population.
Thurcroft and Wickersley South ward has a high proportion of local jobs in education and accommodation and food services. Public sector and manufacturing employment are below borough average. Employment levels in the ward depend on opportunities elsewhere as local jobs are only sufficient for 53% of local workers.
Health
In Thurcroft & Wickersley South 46.2% are in very good health, 1.4% are in very bad health. In comparison, in Rotherham 44.2% are in very good health and 1.6% are in very bad health.
According to Census 2021, in Thurcroft & Wickersley South ward, 20.6% of the population are considered to be disabled under the Equality Act 2010, compared to 21.1% in Rotherham and 17.3% in England.
Life expectancy
In the period 2016-2020, Thurcroft & Wickersley South ward's life expectancy at birth for females is 81.5 years and for males is 77.8 years. This is worse than the England average. In comparison, Rotherham's life expectancy for females is 81.3 years and for males is 77.6 years.
Disease and lifestyle
In the 2016-20 time period, the mortality ratio for deaths from strokes in Thurcroft & Wickersley South ward is 104. This is similar to England. In comparison, the lowest mortality ratio for stroke deaths in a Rotherham ward is 56.7 in Aston & Todwick ward and the highest ratio is 185.8 in Rother Vale ward.
In the 2016-20 time period, the mortality ratio for deaths from respiratory disease in Thurcroft & Wickersley South ward is 141.1. This is worse than England. In comparison, the lowest mortality ratio for deaths from respiratory disease in a Rotherham ward is 79.9 in Bramley & Ravenfield ward and the highest ratio is 209.1 in Rother Vale ward.
In the 2016-20 time period, the mortality ratio for deaths from coronary heart disease in Thurcroft & Wickersley South ward is 115.2. This is similar to England. In comparison, the lowest mortality ratio for deaths from coronary heart disease in a Rotherham ward is 76.2 in Aston & Todwick ward and the highest ratio is 152.1 in Rotherham East ward.
In the 2016-20 time period, the mortality ratio for deaths from circulatory disease in Thurcroft & Wickersley South ward is 112.1. This is similar to England. In comparison, the lowest mortality ratio for deaths from circulatory disease in a Rotherham ward is 73.5 in Aston & Todwick ward and the highest ratio is 141.9 in Rother Vale ward.
In the 2016-20 time period, the mortality ratio for deaths from cancer in Thurcroft & Wickersley South ward is 106.3. This is similar to England. In comparison, the lowest mortality ratio for deaths from cancer in a Rotherham ward is 94.2 in Aston & Todwick ward and the highest ratio is 152.1 in Rother Vale ward.
Obesity
In Thurcroft & Wickersley South ward (for the time period 2019/20-2021/22) the percentage of children in Reception (aged 4-5 years) classified as overweight or obese is 20.3%. This is better than the England average. The percentage of children classified as obese (including severe obesity) is 7.8%. This is better than the England average. In Rotherham overall (for comparison) the percentage of children aged 4-5 years classified as overweight or obese is 25.1% and the percentage classified as obese (including severe obesity) is 11.4%.
In Thurcroft & Wickersley South ward (for the time period 2019/20-2021/22) the percentage of children in Year 6 (aged 10-11 years) classified as overweight or obese is 36.4%. This is worse than the England average. The percentage of children classified as obese (including severe obesity) is 21.2%. This is better than the England average. In Rotherham overall (for comparison) the percentage of children aged 10-11 years classified as overweight or obese is 38.8% and the percentage classified as obese (including severe obesity) is 25.1%.
Education
According to Census 2021, in Thurcroft & Wickersley South ward 21.4% of residents aged 16 or over have no qualifications, and 26.7% are qualified to level 4 or above. In comparison 23.4% in Rotherham have no qualifications and 23.1% are qualified to level 4 or above.
For Thurcroft & Wickersley South ward in 2023, there was a total of 154 pupils at the end of key stage 2, of which 65.6% were disadvantaged compared to 54.5% for Rotherham overall. The percentage of pupils in the ward achieving the expected standard in Reading, Writing and Maths was 63.6%, compared to 54.5% in Rotherham and 59% nationally.
For Thurcroft & Wickersley South ward in 2023, there was a total of 118 pupils at the end of key stage 4, of which 75.4% of pupils were disadvantaged, compared to 53.4% in Rotherham overall. The average Attainment 8 score for the ward was 41.7, compared to 43.2 in Rotherham and 46.2 nationally.
Crime and Anti-Social Behaviour (ASB)
Levels of recorded crime and anti-social behaviour in Thurcroft & Wickersley South ward are lower than the Rotherham average.
In Thurcroft & Wickersley South ward in 2021 there were a total of 943 recorded crimes. This equates to 94 recorded crimes per 1,000 population compared to 110 per 1,000 population for Rotherham.
In Thurcroft & Wickersley South ward in 2021, there were a total of 197 recorded incidents of anti-social behaviour. This equates to 20 recorded incidents per 1,000 population, compared to 19 per 1,000 population for Rotherham.
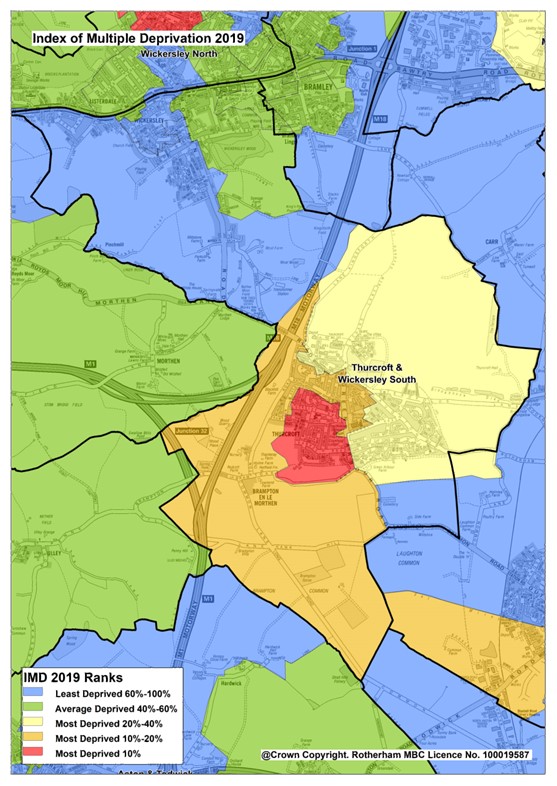
Index of Deprivation
Thurcroft & Wickersley South ward has a rank of 16 out of 25 wards in Rotherham and is in Decile 4. Of the 25 wards in Rotherham, 5 are in the top 20% most deprived in the country (deciles 1 and 2). The top 3 most deprived wards in Rotherham are Rotherham East, Dalton & Thrybergh and Maltby East.
Deprivation in Thurcroft & Wickersley South is below the borough average and most parts of the ward is also below the national average. The neighbourhood of Thurcroft South West is within the most deprived 10% of England, with the neighbourhoods of Thurcroft Central and Brampton in the 20% most deprived nationally.
In Thurcroft & Wickersley South ward, the proportion of all children aged 0-15 living in income deprived families is 21.6% and the proportion of those aged 60 or over who experience income deprivation is 14.4%. The ward with the highest proportion of children aged 0-15 living in income deprived families is Dalton & Thrybergh ward at 39.1%. The ward with the highest proportion of those aged 60 and over who experience income deprivation is Rotherham East ward at 36.9%.
Data Sources
Data sources contained within this document include:
Population - ONS Census data via NOMIS Ethnicity - ONS Census data via NOMIS
Religion - ONS Census data via NOMIS
Housing - ONS Census data via NOMIS
Households - ONS Census data via NOMIS
Unemployment claimants aged 16-64 - ONS Claimant Count via NOMIS
Types of employment - Business Register and Employment Survey via NOMIS
General Health - ONS Census data via NOMIS
Disability - ONS Census data via NOMIS
Life expectancy at birth - Public Health England Fingertips
Causes of death - Public Health England Fingertips
Overweight and obesity in children - Public Health England Fingertips
Highest level of education - ONS Census data via NOMIS
Key Stage 2 and Key Stage 4 attainment - RMBC Children & Young People's Services
Index of Multiple Deprivation - Ministry of Housing, Communities and Local Government Community assets map - OpenStreetMap via TomTom/Microsoft Corporation
Access to green space - Green Space Index 2023 commissioned by The Ordinance Survey and undertaken by The Fields in Trust
Crime data - www.police.uk

