Ward profile
Employment, Benefits and Pension
Crime and Anti-social Behaviour
Description
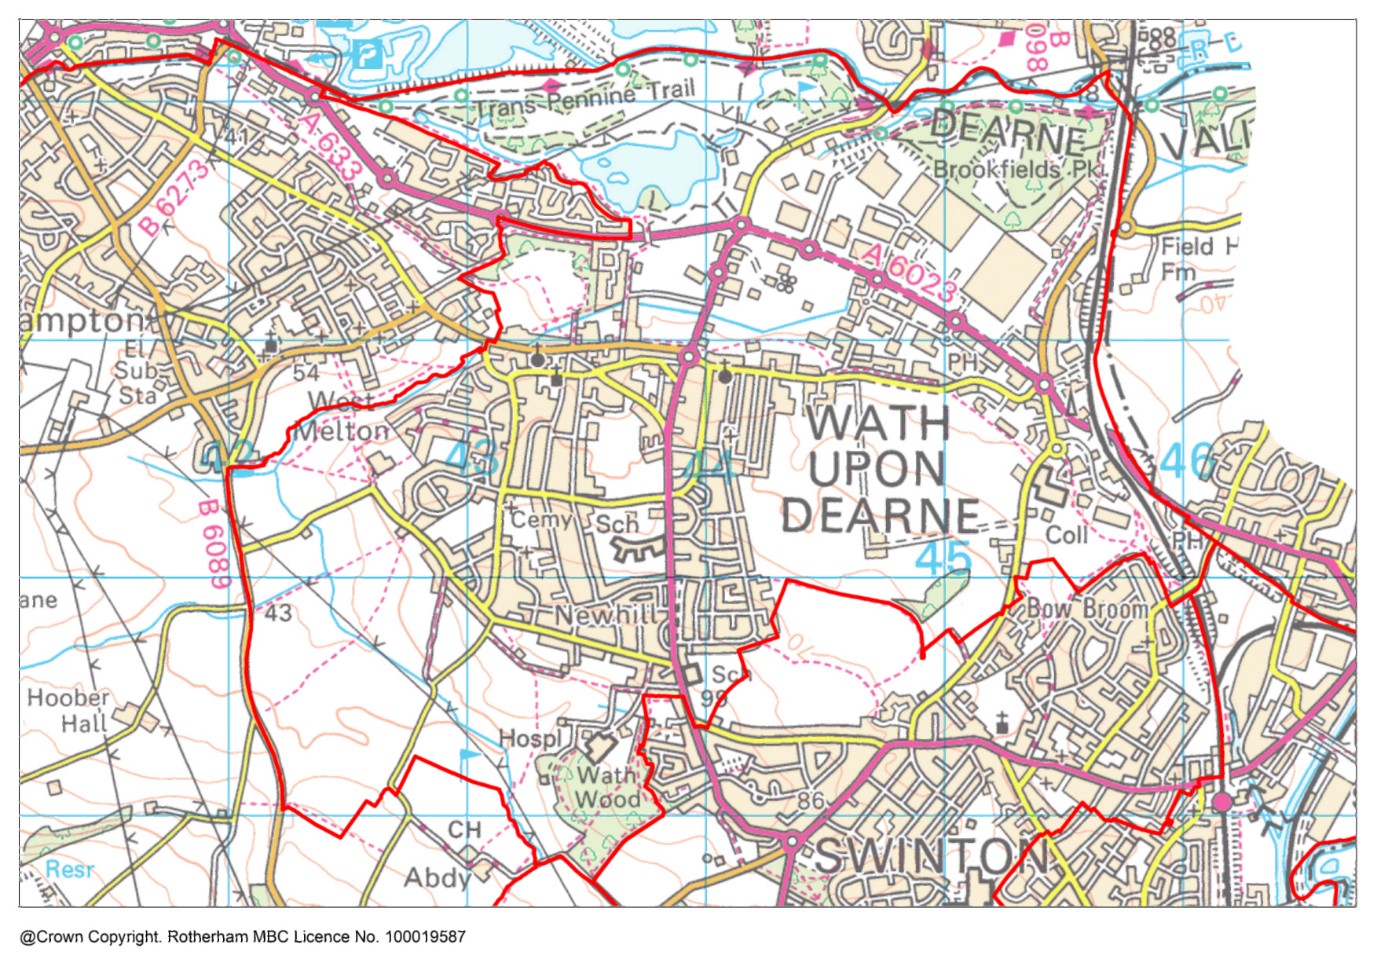
Wath Ward lies in the north of the borough, in the lower Dearne Valley, with a population of 9,271 (2021 census).
The ward is represented by two members of the Council.
Wath upon Dearne is a small town (population 17,000) with a mix of council estates, terraced housing, suburban areas and new housing which make it fairly typical of the borough.
Northwest Wath is the main area of council housing and deprivation although there is also a smaller deprived pocket in the east. South Wath, around Wathwood Hospital, is a private suburban area.
The north of Wath is dominated by the Manvers area which was once a major complex serving the coal industry but is now Rotherham’s largest centre of new industry and employment.
There is also a lake and parkland at Manvers which was developed as part of reclamation of land formerly dominated by the coal industry including Manvers Main colliery and coking plant.
Manvers is also the location of RNN College’s Dearne Valley Campus.
Find out more about Wath on Rotherham Data Hub
Population by Age
The population of Wath ward has hardly changed since 2011, in contrast to the increasing borough population. The age structure of the population is similar to the Rotherham average.
|
Age |
Ward Population |
Ward Percentage |
Rotherham Percentage |
|
Age 00-15 |
1786 |
19.26 |
18.89 |
|
Age 16-24 |
895 |
9.65 |
9.60 |
|
Age 25-44 |
2338 |
25.22 |
25.09 |
|
Age 45-64 |
2353 |
25.38 |
26.76 |
|
Age 65+ |
1899 |
20.48 |
19.66 |
|
Total |
9271 |
100.00 |
100.00 |
Ethnicity
Wath is among the 80% of wards in Rotherham where the white British population exceeds 90%, and the 60% of wards where the 2020 School and Pupil Census shows the white British school age population exceeding 90%.
|
Ethnicity |
Ward % |
Rotherham % |
England % |
|
White British |
94.00 |
88.30 |
74.70 |
|
Asian/Asian British |
0.90 |
5.30 |
9.60 |
|
White Other |
2.40 |
2.80 |
6.30 |
|
Mixed/multiple |
1.60 |
1.40 |
3.00 |
|
Black/Black British |
0.70 |
1.10 |
4.20 |
|
Other |
0.50 |
1.10 |
2.20 |
Housing
Total dwellings (2021 Census) - 4223
Total dwellings (2011 Census) - 3919
Change since 2011 (%) – 7.80
Number of households
Households (2021 Census) - 4018
Households (2011 Census) - 3919
Change since 2011 (%) – 2.50
Population Density (no. of residents per square Kilometre) 2021 Census
Ward – 1097.00
Rotherham - 927.70
Employment, Benefits and Pensions
In Wath ward the total claimant count in July 2023 is 240, which is 4.2% of the working age population. This is similar to the Rotherham average where the claimant count is 4.3% of the working age population.
Wath ward has a high proportion of employment in service sector industries including information & communications, financial and business administrations and support services. Wath ward has the largest number of employment opportunities outside of Boston Castle ward, making up over 15% of all employment in the borough. The ward has three times more employment opportunities than working age residents, meaning it is heavily reliant on labour from outside of the ward.
General Health and Disability
In Wath 40.3% are in very good health, 2.1% are in very bad health. In comparison, in Rotherham 44.2% are in very good health and 1.6% are in very bad health.
According to Census 2021, in Wath ward, 25.9% of the population are considered to be disabled under the Equality Act 2010, compared to 21.1% in Rotherham and 17.3% in England.
Life expectancy
In the period 2016-2020, Wath ward's life expectancy at birth for females is 81 years and for males is 77.3 years. This is worse than the England average. In comparison, Rotherham's life expectancy for females is 81.3 years and for males is 77.6 years.
Disease and lifestyle
In the 2016-20 time period, the mortality ratio for deaths from strokes in Wath ward is 94.5. This is similar to England. In comparison, the lowest mortality ratio for stroke deaths in a Rotherham ward is 56.7 in Aston & Todwick ward and the highest ratio is 185.8 in Rother Vale ward.
In the 2016-20 time period, the mortality ratio for deaths from strokes in Wath ward is 94.5. This is similar to England. In comparison, the lowest mortality ratio for stroke deaths in a Rotherham ward is 56.7 in Aston & Todwick ward and the highest ratio is 185.8 in Rother Vale ward.
In the 2016-20 time period, the mortality ratio for deaths from coronary heart disease in Wath ward is 136.4. This is worse than England. In comparison, the lowest mortality ratio for deaths from coronary heart disease in a Rotherham ward is 76.2 in Aston & Todwick ward and the highest ratio is 152.1 in Rotherham East ward.
In the 2016-20 time period, the mortality ratio for deaths from circulatory disease in Wath ward is 121.9. This is worse than England. In comparison, the lowest mortality ratio for deaths from circulatory disease in a Rotherham ward is 73.5 in Aston & Todwick ward and the highest ratio is 141.9 in Rother Vale ward.
In the 2016-20 time period, the mortality ratio for deaths from cancer in Wath ward is 105. This is similar to England. In comparison, the lowest mortality ratio for deaths from cancer in a Rotherham ward is 94.2 in Aston & Todwick ward and the highest ratio is 152.1 in Rother Vale ward.
Obesity
In Wath ward (for the time period 2019/20-2021/22) the percentage of children in Reception (aged 4-5 years) classified as overweight or obese is 24.5%. This is worse than the England average. The percentage of children classified as obese (including severe obesity) is 8.2%. This is better than the England average. In Rotherham overall (for comparison) the percentage of children aged 4-5 years classified as overweight or obese is 25.1% and the percentage classified as obese (including severe obesity) is 11.4%.
In Wath ward (for the time period 2019/20-2021/22) the percentage of children in Year 6 (aged 10-11 years) classified as overweight or obese is 46.4%. This is worse than the England average. The percentage of children classified as obese (including severe obesity) is 30.4%. This is worse than the England average. In Rotherham overall (for comparison) the percentage of children aged 10-11 years classified as overweight or obese is 38.8% and the percentage classified as obese (including severe obesity) is 25.1%.
Education
According to Census 2021, in Wath ward 26.3% of residents aged 16 or over have no qualifications, and 21.6% are qualified to level 4 or above. In comparison 23.4% in Rotherham have no qualifications and 23.1% are qualified to level 4 or above.
For Wath ward in 2023, there was a total of 136 pupils at the end of key stage 2, of which 69.9% were disadvantaged compared to 54.5% for Rotherham overall. The percentage of pupils in the ward achieving the expected standard in Reading, Writing and Maths was 53.7%, compared to 54.5% in Rotherham and 59% nationally.
For Wath ward in 2023, there was a total of 127 pupils at the end of key stage 4, of which 65.4% of pupils were disadvantaged, compared to 53.4% in Rotherham overall. The average Attainment 8 score for the ward was 45.8, compared to 43.2 in Rotherham and 46.2 nationally.
Crime and Anti-Social Behaviour (ASB)
Levels of recorded crime and anti-social behaviour in Wath ward are higher than the Rotherham average.
In Wath ward in 2021 there were a total of 1,162 recorded crimes. This equates to 125 recorded crimes per 1,000 population compared to 110 per 1,000 population for Rotherham.
In Wath ward in 2021, there were a total of 227 recorded incidents of anti-social behaviour. This equates to 24 recorded incidents per 1,000 population, compared to 19 per 1,000 population for Rotherham.
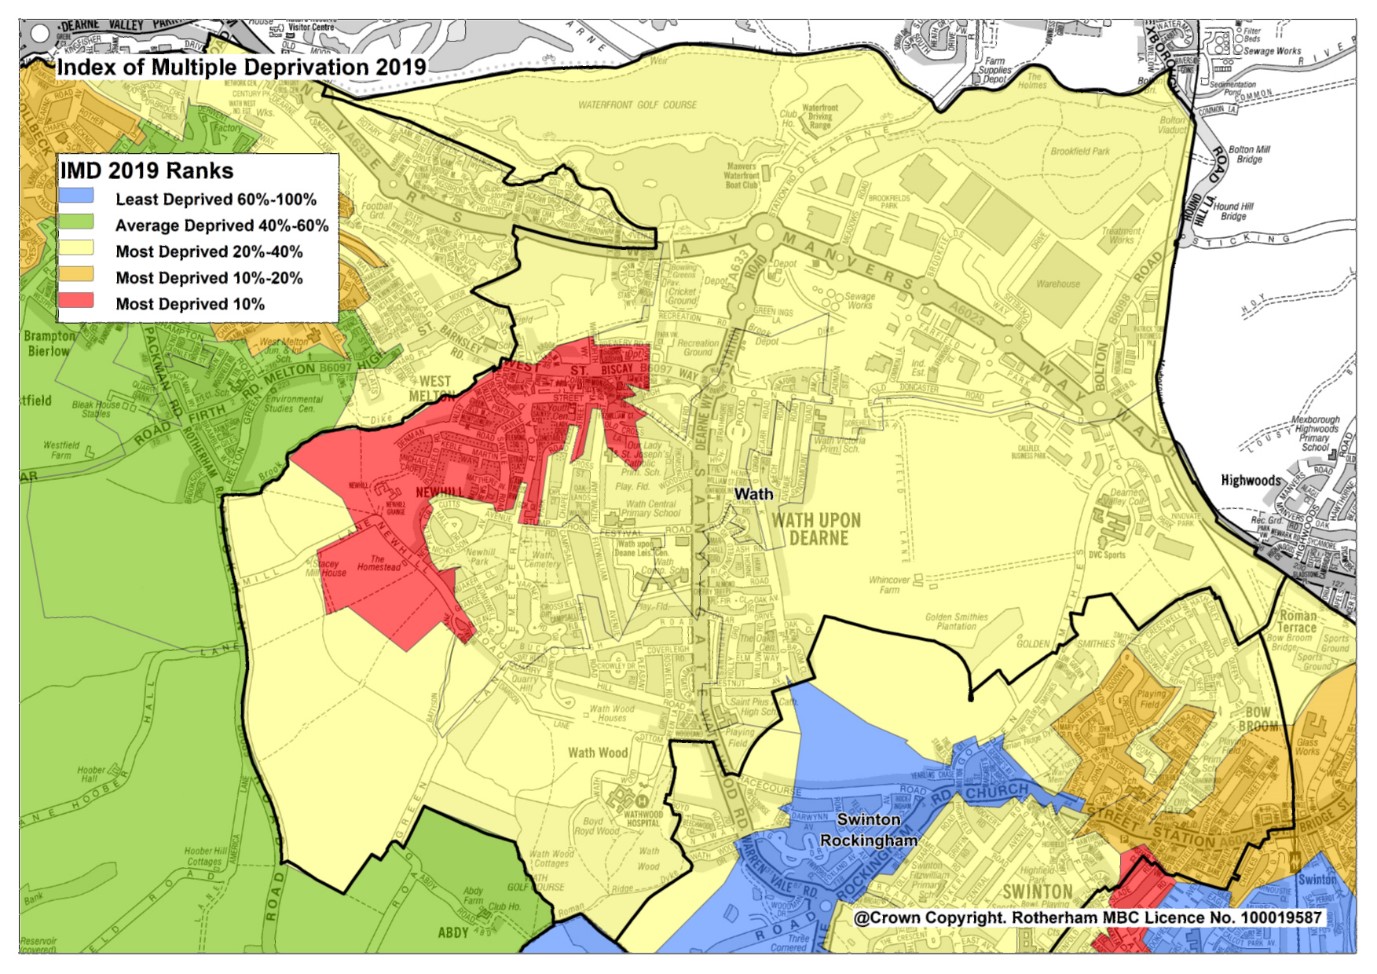
Index of Deprivation
Wath ward has a rank of 8 out of 25 wards in Rotherham and is in Decile 3. Of the 25 wards in Rotherham, 5 are in the top 20% most deprived in the country (deciles 1 and 2). The top 3 most deprived wards in Rotherham are Rotherham East, Dalton & Thrybergh and Maltby East.
Deprivation in Wath ward is above the borough average and most parts of the ward are above the national average. The two neighbourhoods of Wath Central and Newhill are within the most deprived 10% in England.
In Wath ward, the proportion of all children aged 0-15 living in income deprived families is 24.4% and the proportion of those aged 60 or over who experience income deprivation is 16.6%. The ward with the highest proportion of children aged 0-15 living in income deprived families is Dalton & Thrybergh ward at 39.1%. The ward with the highest proportion of those aged 60 and over who experience income deprivation is Rotherham East ward at 36.9%.
Data Sources
Data sources contained within this document include:
Population - ONS Census data via NOMIS Ethnicity - ONS Census data via NOMIS
Religion - ONS Census data via NOMIS
Housing - ONS Census data via NOMIS
Households - ONS Census data via NOMIS
Unemployment claimants aged 16-64 - ONS Claimant Count via NOMIS
Types of employment - Business Register and Employment Survey via NOMIS
General Health - ONS Census data via NOMIS
Disability - ONS Census data via NOMIS
Life expectancy at birth - Public Health England Fingertips
Causes of death - Public Health England Fingertips
Overweight and obesity in children - Public Health England Fingertips
Highest level of education - ONS Census data via NOMIS
Key Stage 2 and Key Stage 4 attainment - RMBC Children & Young People's Services
Index of Multiple Deprivation - Ministry of Housing, Communities and Local Government Community assets map - OpenStreetMap via TomTom/Microsoft Corporation
Access to green space - Green Space Index 2023 commissioned by The Ordinance Survey and undertaken by The Fields in Trust
Crime data - www.police.uk

